TheLyppardMan
Very Senior Member
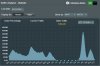
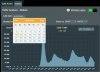
Would someone mind explaining traffic statistics for me as I'm confused? Screenshot 1 shows the opening graph when I clicked on traffic statistics. Screenshot 2 shows what the graph changed to after I clicked on today's date. It was about 11.18AM UK time when I took these readings. The part I am finding confusing is the second graph appears to be predicting what data usage there will be for the remainder of today. I know my router is clever, but I didn't think it was that clever! Or am I missing something obvious?