Xruptor
Regular Contributor
I miss how Tomato displayed all it's QoS information. I know QoS is implemented in AsusWRT but there are some things that are lacking, that I wish were implemented. It's possible that I may have completely overlooked it and it's already implemented. Which is why I'm asking here if it's something that can be done via GUI or SSH console? If it's already been implemented.
BTW I know there is Traditional and Dynamic QoS. I would like to see the flow of QoS connections for both in a similar way. Regardless if I'm using Dynamic or Traditional.
On the Tomato qos_graphs, you can see the chunks used by each class in the QoS system.

1) So my first request/question. I miss being able to actually click on each of the classes (chunks on the graph) Tomato graphs and see an active list of connections, filtered by LAN source IP, Protocol, PORT and Bytes in/out.
I really wish there was a way to see a better display by IP. Yes, I'm aware you can turn on IPTraffic to do something similar. However, the current implementation of the "Real-Time" display per device on AsusWRT only displays total sums of connections per device and bytes in/out. It doesn't however show a list of active connections per device/ip and their ports/protocols. That's why I wonder if there is a way to do it like the old Tomato firmware charts.
So for example if in the chart I click on P22/Bulk (Class E on image above). I would be taken to a list of active connections using that class.

Right there I can see what IP address is using that QoS class. The active ports source/destination. Even the real time bytes out/in. Current I don't know of anything like this in AsusWRT. This was a tremendous tool to see what is hogging up connections and easily blocking ports and such.
Is something like this already implemented or can be implemented for both Traditional and Dynamic QoS? Would be nice to see where everything is being reallocated to and it's break down by connection.
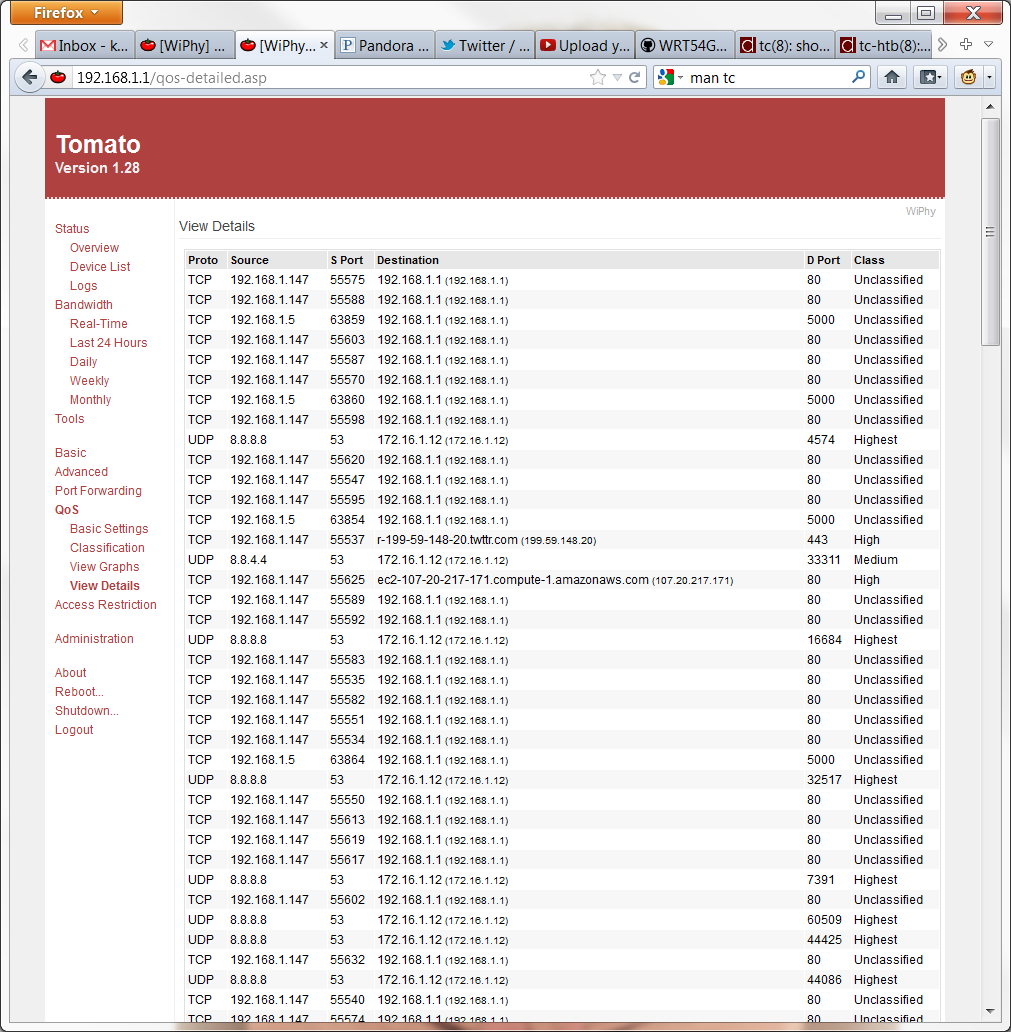
2) My other question from the original Tomato Firmware. If you were to click on 'View Details' as found on the image above. You would get something like this.

It's similar to the one I posted above in the first question. The primary difference is that this one shows all connections regardless of QOS class. It does however allow me to sort them using the columns above.
Conclusion:
So is there anyway to grab or display the data as stated in my first and second question? The current implementation of AsusWRT for QOS graphs do not allow you to click on them. What I mean is that you can't click any part of the pie graph to see more details on the actual filtered classes. The only thing it tells you is the total bandwidth that was used per class by hovering over with the mouse, but that's about it.
The IPTraffic graphs are also pretty restrictive. You can't really click on any of the graphs or break down the traffic on a per connection basis. The only thing you can see is total daily input by IP address. That or you can see the total connection per IP. But not broken down by port and total bytes in/out by port.
I used to use these tools to track down major traffic hogs and see exactly where and how the QoS system was classifying stuff. I really do miss those features
BTW I know you can go to System Logs -> Connections then click (refresh) but it's not really the same thing as the GUI interface display as provided by the old Tomato QOS pages.
BTW I know there is Traditional and Dynamic QoS. I would like to see the flow of QoS connections for both in a similar way. Regardless if I'm using Dynamic or Traditional.
On the Tomato qos_graphs, you can see the chunks used by each class in the QoS system.

1) So my first request/question. I miss being able to actually click on each of the classes (chunks on the graph) Tomato graphs and see an active list of connections, filtered by LAN source IP, Protocol, PORT and Bytes in/out.
I really wish there was a way to see a better display by IP. Yes, I'm aware you can turn on IPTraffic to do something similar. However, the current implementation of the "Real-Time" display per device on AsusWRT only displays total sums of connections per device and bytes in/out. It doesn't however show a list of active connections per device/ip and their ports/protocols. That's why I wonder if there is a way to do it like the old Tomato firmware charts.
So for example if in the chart I click on P22/Bulk (Class E on image above). I would be taken to a list of active connections using that class.

Right there I can see what IP address is using that QoS class. The active ports source/destination. Even the real time bytes out/in. Current I don't know of anything like this in AsusWRT. This was a tremendous tool to see what is hogging up connections and easily blocking ports and such.
Is something like this already implemented or can be implemented for both Traditional and Dynamic QoS? Would be nice to see where everything is being reallocated to and it's break down by connection.
2) My other question from the original Tomato Firmware. If you were to click on 'View Details' as found on the image above. You would get something like this.

It's similar to the one I posted above in the first question. The primary difference is that this one shows all connections regardless of QOS class. It does however allow me to sort them using the columns above.
Conclusion:
So is there anyway to grab or display the data as stated in my first and second question? The current implementation of AsusWRT for QOS graphs do not allow you to click on them. What I mean is that you can't click any part of the pie graph to see more details on the actual filtered classes. The only thing it tells you is the total bandwidth that was used per class by hovering over with the mouse, but that's about it.
The IPTraffic graphs are also pretty restrictive. You can't really click on any of the graphs or break down the traffic on a per connection basis. The only thing you can see is total daily input by IP address. That or you can see the total connection per IP. But not broken down by port and total bytes in/out by port.
I used to use these tools to track down major traffic hogs and see exactly where and how the QoS system was classifying stuff. I really do miss those features
BTW I know you can go to System Logs -> Connections then click (refresh) but it's not really the same thing as the GUI interface display as provided by the old Tomato QOS pages.

