What's new
  • SNBForums Code of Conduct

    SNBForums is a community for everyone, no matter what their level of experience.

    Please be tolerant and patient of others, especially newcomers. We are all here to share and learn!

    The rules are simple: Be patient, be nice, be helpful or be gone!

vnStat [Release] vnStat-on-Merlin - UI, CLI and email - data use and data limit monitoring - R1 and R2

this might actually be better answered by @Vergo
as far as I can tell the date format we're using is: MonthFormat "%Y-%m (%d)"

so I guess its simply pulling the date for the month, rather than referring to MonthRotate

Sorry for not noticing this earlier as that ping didn't result in an email notification for some reason.

In the sqlite database, "date" in the "month" table really contains only the month as information. It's being constructed with "strftime('%%Y-%%m-01', %s%s)" or "strftime('%%Y-%%m-01', datetime(%s, '-%d days')%s)" if MonthRotate isn't 1 resulting in the MonthRotate information not being included in that field at all. That's why MonthFormat "%Y-%m (%d)" doesn't work. That's actually the first time I see MonthRotate being injected to the monthly report like that... and looking at the image it produces, there's some column misalignment being created as a side effect.

I'm aware that it would be nice to have the MonthRotate information directly visible in the reports. There's for example this issue https://github.com/vergoh/vnstat/issues/72 still open for pretty much the same matter. It however does mention also a workaround that may fit your case: have a script which reads the MonthRotate value and if it's something else than 1 then reformat MonthFormat in the configuration file to "%Y-%m-N" where N is the value directly. As both "vnstat" and "vnstati" read the configuration file on every run, there's no need to restart the daemon on change as it doesn't care about that configuration entry.

I'm open to suggestions if you have ideas how the outputs should be formatted to better display a non-default MonthRotate configuration.
 
@dev_null @Jack Yaz

My vnStats appears to have "blown up" yesterday after I did what I thought was a routine "controlled" reboot from the router GUI (after updating Connmon beta 3.0 in fact Jack).
I noticed this morning that no new uploads/downloads appear to have been recorded/graphed for after that reboot, which is now nearly a day.
I did another reboot once I noticed but that didn't fix it. I force-reinstalled VNStat with a "uf" and did another reboot, still didn't fix it.
All my other AMTM Add-Ons appear to be running fine, and my USB with swap file is there and seemingly OK.

Any tips on trouble-shooting this? Things to check and or look for?

EDIT 1:- (Later that day) I ended up backing up /opt/var/lib/vnstat/vnstat.db and then doing a full uninstall/reinstall, then putting back the "old" database but still no-go, so I'm assuming it was corrupted somehow. So I've started again from new, and it all seems to be working. I've got the "old" database file if either of you would like to examine it for clues, but it's probably only of academic interest now?

EDIT 2:- I had a look at the old db file with a macOS utility I have (DB Browser for SQLite). It loaded OK but failed an integrity check when I ran one on it.
 
Last edited:
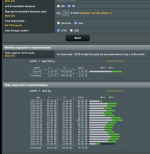
I'm open to suggestions if you have ideas how the outputs should be formatted to better display a non-default MonthRotate configuration.
@Vergo

My 2 cents ... for the monthly display as in:-

Google Chrome192.168.1.254dn-vnstat - Google ChromeScreen Shot 25 Aug 2021 at 17.32.56.jpg


For non-default MonthRotate configurations, using my own example of it starting on Day 14, if the "month" column was labelled "month starting" instead, then each period could be labelled "2021-08-14", 2021-09-14" etc instead of "2021-08", "2021-09" etc ...
 
Thanks for script! I found a bug: The start day stays at 1 even though I set it to 16 during amtm installation and afterward. I'm running the latest version on a AX58U with 386.3_2.
 
@dev_null @Jack Yaz

My vnStats appears to have "blown up" yesterday after I did what I thought was a routine "controlled" reboot from the router GUI (after updating Connmon beta 3.0 in fact Jack).
I noticed this morning that no new uploads/downloads appear to have been recorded/graphed for after that reboot, which is now nearly a day.
I did another reboot once I noticed but that didn't fix it. I force-reinstalled VNStat with a "uf" and did another reboot, still didn't fix it.
All my other AMTM Add-Ons appear to be running fine, and my USB with swap file is there and seemingly OK.

Any tips on trouble-shooting this? Things to check and or look for?

EDIT 1:- (Later that day) I ended up backing up /opt/var/lib/vnstat/vnstat.db and then doing a full uninstall/reinstall, then putting back the "old" database but still no-go, so I'm assuming it was corrupted somehow. So I've started again from new, and it all seems to be working. I've got the "old" database file if either of you would like to examine it for clues, but it's probably only of academic interest now?

EDIT 2:- I had a look at the old db file with a macOS utility I have (DB Browser for SQLite). It loaded OK but failed an integrity check when I ran one on it.
Sounds like it was corrupted somehow. I'd check your usb for errors too, because in all my testing I never lost a db due to corruption.

Was the utility not able to repair the integrity error? Jack might have more suggestions, but I don't think there's anything special about the format of the db file.
 
Sounds like it was corrupted somehow. I'd check your usb for errors too, because in all my testing I never lost a db due to corruption.

Yes, it’s a mystery to me. USB tests as utterly fine. Zero disk-related glitches in 6 months on this setup for any and all AMTM scripts, despite lots of attempts by me to break it! :)

(I’m using a rotating pair of Sandisk 64GB “Max Endurance” microSD cards in little Sandisk uSD-to-USB 3.0 adapters, and they’ve been utterly reliable. Good compact setup. I just clone an image backup onto the “spare” every month or so and then rotate that into use on the router).

Will poke around some more on the suspect database but for now I’m just writing it off to experience unless it reoccurs …

Thanks again for great script BTW, much appreciated.
 
Hi,

New user on Merlin. I
Installed vnstat on the 13/08 last month using version: 2.01


But it is not updating after the 31st. What di i do wrong here ?
Bandwidth allowing cycle set to - 1
 

Attachments

  • Screen Shot 2021-09-03 at 22.13.14.png
    Screen Shot 2021-09-03 at 22.13.14.png
    470.9 KB · Views: 81
Last edited:
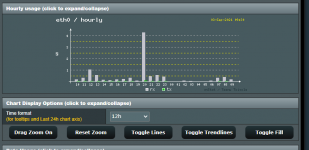
Sorry to pile-on, but in vn-stat, I have the display set to 12h display but in the graphs with a time, they still show the 24h time. Attached is an example. That's also true for the CLI display.
 

Attachments

  • vnstat.PNG
    vnstat.PNG
    19.6 KB · Views: 84
Sorry to pile-on, but in vn-stat, I have the display set to 12h display but in the graphs with a time, they still show the 24h time. Attached is an example. That's also true for the CLI display.
the 12h only affects the chartjs charts not the vnstati images
 
Hi,

New user on Merlin. I
Installed vnstat on the 13/08 last month using version: 2.01


But it is not updating after the 31st. What di i do wrong here ?
Bandwidth allowing cycle set to - 1
what happens if you manually try to kick the stats with the update button or cli menu 1?
 
Somehow my sidebar didnt show webui button, if i go directly to user1.asp it can show

WebUI for dn-vnstat is available at:
WebUI page not found

Check to see if NTP is sync'd. Make sure all the JackYaz addons are current, then reboot.
 
I have the display set to 12h display but in the graphs with a time, they still show the 24h time. Attached is an example. That's also true for the CLI display.
the 12h only affects the chartjs charts not the vnstati images
I believe this is a vntati (app, not vnStat-on-Merlin implementation) limitation. There are several settings in the vnstat.conf that control how the date and time is displayed, but I don't think those modify the image displays, as Jack notes. You could try modifying those %H (capital-H) to %h (lowercase-H) and reboot to see if that makes a difference.
 
Couple things this morning (afternoon on the other side of the pond):

  • I've confirmed that the version of vnstat that R2 is based on handles certain flags differently than R1, particularly dates, and specifically the "month start" date we used in parens, and also the month name ("Aug" for %M). The workaround envisaged would actually change the "month start" to the "AllowanceStartDay", but that breaks the display in a different way: by changing that field regardless of the actual "month start" day (so even if January and February were monthstart=01, it would now show 14).

    Fortunately, the month start is listed in the same frame on the UI and is included in the summary emails. In the interest of accuracy, the best method of dealing with this is to remove it from the R2 monthly usage metrics. It will remain in R1 and we'll monitor to see if it can be reintroduced to R2.

    This update will probably be rolled out sometime this week (there are other things in the hopper that might be ready as well... stand by!).

  • I listed the incorrect location for the R2 database file. If you're saving on the USB, it's /opt/var/lib/vnstat/vnstat.db, otherwise this file is on JFFS. Calling this out to @jb68 particularly. A thousand apologies...

Managed to recover it and store it on JFFS, all stats saved :)
 
Hi everyone, my vnStats are stuck after a reboot again. This time I had the time sync enabled, and it appears that part worked, but still my stats are not updating.

I have the latest version, 2.0.1.

This shows the problem, stats as of 10am, data only goes up to 5am when the reboot happened. I did a manual update stats, but it didn't change anything.

Any ideas? I didn't see any unusual messages in the syslog, vnstat seemed to start without problems.

Code:
vnstats as of: Sun Sep  5 10:00:07 DST 2021


 eth0  /  hourly

     hour        rx      |     tx      |    total
-------------------------+-------------+------------
 2021-09-04
     05:00       2.90 MB |     1.25 MB |     4.15 MB
     06:00     274.60 MB |    10.17 MB |   284.77 MB
     07:00     184.05 MB |     9.93 MB |   193.98 MB
[etc...]
 2021-09-05
     00:00      24.21 MB |     5.94 MB |    30.15 MB
     01:00      97.83 MB |    13.77 MB |   111.60 MB
     02:00     137.02 MB |     6.20 MB |   143.21 MB
     03:00     278.08 MB |    13.07 MB |   291.15 MB
     04:00      58.29 MB |     4.18 MB |    62.47 MB
     05:00      84.08 MB |     9.74 MB |    93.82 MB
-------------------------+-------------+------------
 
Hi everyone, my vnStats are stuck after a reboot again. This time I had the time sync enabled, and it appears that part worked, but still my stats are not updating.

I have the latest version, 2.0.1.

This shows the problem, stats as of 10am, data only goes up to 5am when the reboot happened. I did a manual update stats, but it didn't change anything.

Any ideas? I didn't see any unusual messages in the syslog, vnstat seemed to start without problems.

Code:
vnstats as of: Sun Sep  5 10:00:07 DST 2021


eth0  /  hourly

     hour        rx      |     tx      |    total
-------------------------+-------------+------------
2021-09-04
     05:00       2.90 MB |     1.25 MB |     4.15 MB
     06:00     274.60 MB |    10.17 MB |   284.77 MB
     07:00     184.05 MB |     9.93 MB |   193.98 MB
[etc...]
2021-09-05
     00:00      24.21 MB |     5.94 MB |    30.15 MB
     01:00      97.83 MB |    13.77 MB |   111.60 MB
     02:00     137.02 MB |     6.20 MB |   143.21 MB
     03:00     278.08 MB |    13.07 MB |   291.15 MB
     04:00      58.29 MB |     4.18 MB |    62.47 MB
     05:00      84.08 MB |     9.74 MB |    93.82 MB
-------------------------+-------------+------------
is vnstatd running?
Code:
/opt/etc/init.d/S33vnstat check
 
Well look at that, it's dead, Jim...

Code:
> /opt/etc/init.d/S33vnstat check
 Checking vnstatd...              dead.

I used the command to start, and got this:
Code:
Sep  5 10:13:58 AC86U-MAIN vnstat: Starting monitoring for interface eth0
Sep  5 10:13:58 AC86U-MAIN vnstatd[25058]: vnStat daemon 2.7 started. (pid:25058 uid:0 gid:0 64-bit)
Sep  5 10:13:58 AC86U-MAIN vnstatd[25058]: Monitoring (1): eth0 (1000 Mbit)
Sep  5 10:13:58 AC86U-MAIN A1MeshBoss: Started vnstatd from .

I did not see those messages in the syslog from the reboot.

In fact, this happened (I was looking for dn-vnstat and missed this):
Code:
May  5 00:05:27 AC86U-MAIN vnstat: Starting monitoring for interface eth0
May  5 00:05:27 AC86U-MAIN vnstat: NTP not synced, exiting
[...]
May  5 00:05:46 AC86U-MAIN scMerlin: Waiting for NTP to sync...
[...]
May  5 00:06:16 AC86U-MAIN scMerlin: Waiting for NTP to sync...
May  5 00:06:38 AC86U-MAIN ntpbootwatchdog: Still waiting for NTP to sync...
[...]
May  5 00:06:39 AC86U-MAIN custom_script: Running /jffs/scripts/service-event-  end (args: restart ntpd)
Sep  5 05:25:05 AC86U-MAIN rc_service: ntpd_synced 4439:notify_rc restart_diskmon
[...]
Sep  5 05:25:11 AC86U-MAIN scMerlin: NTP synced, scMerlin will now continue
Sep  5 05:25:13 AC86U-MAIN dn-vnstat: Mounting WebUI tab for dn-vnstat
Sep  5 05:25:13 AC86U-MAIN dn-vnstat: Mounted dn-vnstat WebUI page as user3.asp
Sep  5 05:25:25 AC86U-MAIN crond[1212]: time disparity of 1755679 minutes       detected
Sep  5 05:25:25 AC86U-MAIN A1MeshBoss: Started /jffs/addons/scmerlin.d/tailtopd from .
Sep  5 05:25:25 AC86U-MAIN scMerlin: Mounting WebUI tabs for scMerlin
Sep  5 05:25:26 AC86U-MAIN scMerlin: Mounted Sitemap page as user6.asp
Sep  5 05:25:26 AC86U-MAIN scMerlin: Mounted scMerlin WebUI page as user5.asp
Sep  5 05:25:34 AC86U-MAIN ntpbootwatchdog: NTP has synced!
[...]

What seems strange to me is how early vnstat starts! It bails at "05:27" (pre-sync) when according to the logs the first sign of time sync is after "06:39" or over a minute later! And the watchdog itself doesn't claim sync for another 30 seconds after that!

So any idea why vnstat is not waiting for the watchdog? I just checked the box in scMerlin for the watchdog.
 
Well look at that, it's dead, Jim...

Code:
> /opt/etc/init.d/S33vnstat check
Checking vnstatd...              dead.

I used the command to start, and got this:
Code:
Sep  5 10:13:58 AC86U-MAIN vnstat: Starting monitoring for interface eth0
Sep  5 10:13:58 AC86U-MAIN vnstatd[25058]: vnStat daemon 2.7 started. (pid:25058 uid:0 gid:0 64-bit)
Sep  5 10:13:58 AC86U-MAIN vnstatd[25058]: Monitoring (1): eth0 (1000 Mbit)
Sep  5 10:13:58 AC86U-MAIN A1MeshBoss: Started vnstatd from .

I did not see those messages in the syslog from the reboot.

In fact, this happened (I was looking for dn-vnstat and missed this):
Code:
May  5 00:05:27 AC86U-MAIN vnstat: Starting monitoring for interface eth0
May  5 00:05:27 AC86U-MAIN vnstat: NTP not synced, exiting
[...]
May  5 00:05:46 AC86U-MAIN scMerlin: Waiting for NTP to sync...
[...]
May  5 00:06:16 AC86U-MAIN scMerlin: Waiting for NTP to sync...
May  5 00:06:38 AC86U-MAIN ntpbootwatchdog: Still waiting for NTP to sync...
[...]
May  5 00:06:39 AC86U-MAIN custom_script: Running /jffs/scripts/service-event-  end (args: restart ntpd)
Sep  5 05:25:05 AC86U-MAIN rc_service: ntpd_synced 4439:notify_rc restart_diskmon
[...]
Sep  5 05:25:11 AC86U-MAIN scMerlin: NTP synced, scMerlin will now continue
Sep  5 05:25:13 AC86U-MAIN dn-vnstat: Mounting WebUI tab for dn-vnstat
Sep  5 05:25:13 AC86U-MAIN dn-vnstat: Mounted dn-vnstat WebUI page as user3.asp
Sep  5 05:25:25 AC86U-MAIN crond[1212]: time disparity of 1755679 minutes       detected
Sep  5 05:25:25 AC86U-MAIN A1MeshBoss: Started /jffs/addons/scmerlin.d/tailtopd from .
Sep  5 05:25:25 AC86U-MAIN scMerlin: Mounting WebUI tabs for scMerlin
Sep  5 05:25:26 AC86U-MAIN scMerlin: Mounted Sitemap page as user6.asp
Sep  5 05:25:26 AC86U-MAIN scMerlin: Mounted scMerlin WebUI page as user5.asp
Sep  5 05:25:34 AC86U-MAIN ntpbootwatchdog: NTP has synced!
[...]

What seems strange to me is how early vnstat starts! It bails at "05:27" (pre-sync) when according to the logs the first sign of time sync is after "06:39" or over a minute later! And the watchdog itself doesn't claim sync for another 30 seconds after that!

So any idea why vnstat is not waiting for the watchdog? I just checked the box in scMerlin for the watchdog.

A better question is why is it taking so long to sync time. Mine generally syncs within a minute or two, and only once can I recall seeing an extended period before sync, which was resolved by a reboot.

dn-vnstat (the script) waits for 600 seconds after boot for NTP to sync, as do most or all of the Merlin scripts. vnStat (linux application) launches earlier, via S33vnstat, as Jack indicated above.

I think your configuration is somehow faulty, particularly if vnStat (linux application) is showing as dead. That tells me that it didn't launch properly, for whatever reason.

It may be time for a complete reset and manual reconfiguration. You can save the database, but if you continue to get errors, then you might need to blast the db away too.

@Jack Yaz may have other thoughts, but I did not encounter the issues you are seeing in my extensive testing from pre-R1 to present R2.
 
@dev_null
Just playing around with the various graphing options and I think I may have encountered a bug /display error in R2 on my RT-AX86U?

For the "Compare Usage" graph, if I set the Options to Days (and GB and Logarithmic but that doesn't make a difference) I get the following display:-


dn-vnstat Compare Usage.jpg


The bar graphs for "Current 7 days - Received" and "Previous 7 days - Sent" overlap and obscure each other.
I presume that all 4 bars are meant to be side by side and not overlap each other?

Is anyone else seeing this?
I've tried a few different Browsers with the same result.
 

Latest threads

Support SNBForums w/ Amazon

If you'd like to support SNBForums, just use this link and buy anything on Amazon. Thanks!

Sign Up For SNBForums Daily Digest

Get an update of what's new every day delivered to your mailbox. Sign up here!
Back
Top