What's new

Ax88U cpu loads

  • SNBForums Code of Conduct

    SNBForums is a community for everyone, no matter what their level of experience.

    Please be tolerant and patient of others, especially newcomers. We are all here to share and learn!

    The rules are simple: Be patient, be nice, be helpful or be gone!

Sabbath81

Regular Contributor
Hi guys,

i notice recently that my ax88u, running latest stable merlin wrt + diversion + skynet + uidivstats + transmission, behaves strange:

after reboot / power up, 4 cores report 0-1% load. The next day is 1-2%, the next one is 2-4% and etc.

So after approx 2 weeks , cpu loads reach a state where kernel log reports errors , network degradation and router needs a reboot.

Any ideas why is this happening? How to solve it?
 
SSH into the router when the problem's obvious and run top to see what is consuming the CPU.
 
"latest stable Merlin" means nothing. If you want to specify a version, just put the actual number in, please.

Personally, and against popular opinion, I like to let my router be a router. If you really need all that other "stuff", why not move it over to a $30 raspberry pi?

Other than the suggestion by Colin, you could move or disable all those scripts and services, then put them back one at a time. I can guarantee this is where your issue lies, one of those add ons.
Current version 386.5_2

as for the raspberry, haven't thought about it. I will post the output of "top" once CPU load again goes high. I also think its one of the add-ons, just not sure which one.
 
i notice recently that my ax88u, running latest stable merlin wrt + diversion + skynet + uidivstats + transmission, behaves strange:

So after approx 2 weeks , cpu loads reach a state where kernel log reports errors , network degradation and router needs a reboot.
My first guess (based on similar experience) is: remove (or stop) Transmission - it simply does not work stable on our small routers (not enough memory & CPU) !
 
Last edited:
I would just get yourself a RPI( with a USB HD attached)and install Dietpi and the software Deluge, just a couple of clicks and deluge is setup

 
...
after reboot / power up, 4 cores report 0-1% load. The next day is 1-2%, the next one is 2-4% and etc.

So after approx 2 weeks , cpu loads reach a state where kernel log reports errors , network degradation and router needs a reboot.
Based on your problem description, it looks like what you're talking about is CPU Utilization, *not* CPU Load. The terms refer to two different & separate metrics and are not interchangeable, but I understand that they can be easily confused.

Current version 386.5_2

as for the raspberry, haven't thought about it. I will post the output of "top" once CPU load again goes high. I also think its one of the add-ons, just not sure which one.
Adding to the recommendation that @ColinTaylor already posted, I’d suggest getting a couple of snapshots of the top command output when your router is working well & under "normal" conditions. These will be your baseline to compare against the snapshots taken when the router shows signs of being overloaded & CPU Utilization becomes significantly higher than expected.

And if you follow @dosborne recommendation, take the "before & after" snapshots once you remove/disable all add-ons, and then again as you proceed to reinstall/enable each, one at a time, to figure out if one of them is the cause of the problem.

When chasing a runtime problem, I've found it very useful to have several "before & after" data samples to compare & analyze the problem with, and often get more clues to what the root cause might be.
 
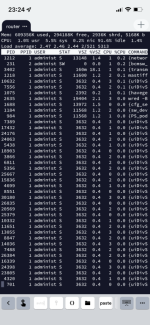
Top output from today….
 

Attachments

  • 4594FC10-5FCD-4BED-9B8E-6B2AB9D86A01.png
    4594FC10-5FCD-4BED-9B8E-6B2AB9D86A01.png
    191 KB · Views: 159
Top output from today….
That's a very high number of "uiDivStats" processes (roughly about 2 dozens shown on the screenshot - Who knows how many more are unseen). I don't use this add-on, but I'm suspicious if that's really "normal." It would be inefficient to keep that many processes running at once, idling but each taking a small chunk of RAM.

Out of curiosity, can you post the output of the following command?
ps | grep "uiDivStats" | grep -cv "grep uiDivStats"
EDIT: Corrected command syntax (thanks to @ColinTaylor for pointing it out).

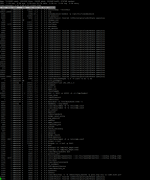
Try posting a screenshot taken from a PC so that we can see the commands on the right hand side.
I second that, especially because it would be easier to read as well on a larger, wider screenshot.
 
Last edited:
Out of curiosity, can you post the output of the following command?

ps | grep -c "uiDivStats" | grep -cv "grep uiDivStats"

I'm guessing you really meant to say:
Code:
ps | grep "uiDivStats" | grep -cv "grep uiDivStats"
 
Top output from today….
Here's a thread about uiDivStats where users have reported finding a very large (10-12GB) database file in the "/opt/share/uiDivStats.d" directory. You might want to check that just in case. At least it could be a clue.
 
Hello,

here are the outputs:

RT-AX88U:/tmp/home/root# ps | grep "uiDivStats" | grep -cv "grep uiDivStats"
223

I indeed see a large amount of uidivstats entries, maybe its worthy to remove this ?

Mem: 711244K used, 192300K free, 2900K shrd, 28108K buff, 87688K cached
CPU: 1.6% usr 7.0% sys 0.2% nic 90.9% idle 0.0% io 0.0% irq 0.0% sirq
Load average: 2.50 2.54 2.50 4/630 6745
PID PPID USER STAT VSZ %VSZ CPU %CPU COMMAND
1212 1 administ S 13148 1.4 3 0.2 networkmap --bootwait
1218 1 administ S 11600 1.2 1 0.1 mastiff
2118 29895 administ R 3500 0.3 2 0.1 top
1068 1 administ S 13452 1.4 2 0.1 nt_monitor
231 2 administ SW 0 0.0 0 0.1 [bcmsw_rx]
3402 1 administ S 160m 18.1 1 0.0 transmission-daemon -g /opt/etc/transmission
1688 1 administ S 13972 1.5 1 0.0 cfg_server
1181 1 administ S 11568 1.2 1 0.0 watchdog
1184 1 administ S 11568 1.2 2 0.0 sw_devled
1177 1 administ S 4976 0.5 2 0.0 vis-datacollector
27897 1 administ S 3632 0.4 1 0.0 {uiDivStats} /bin/sh /jffs/scripts/uiDivStats querylog
7389 1 administ S 3632 0.4 0 0.0 {uiDivStats} /bin/sh /jffs/scripts/uiDivStats querylog
28913 1 administ S 3632 0.4 0 0.0 {uiDivStats} /bin/sh /jffs/scripts/uiDivStats querylog
24176 1 administ S 3632 0.4 2 0.0 {uiDivStats} /bin/sh /jffs/scripts/uiDivStats querylog
19583 1 administ S 3632 0.4 1 0.0 {uiDivStats} /bin/sh /jffs/scripts/uiDivStats querylog
8263 1 administ S 3632 0.4 0 0.0 {uiDivStats} /bin/sh /jffs/scripts/uiDivStats querylog
31908 1 administ S 3632 0.4 0 0.0 {uiDivStats} /bin/sh /jffs/scripts/uiDivStats querylog
7182 1 administ S 3632 0.4 0 0.0 {uiDivStats} /bin/sh /jffs/scripts/uiDivStats querylog
18484 1 administ S 3632 0.4 0 0.0 {uiDivStats} /bin/sh /jffs/scripts/uiDivStats querylog
21658 1 administ S 3632 0.4 0 0.0 {uiDivStats} /bin/sh /jffs/scripts/uiDivStats querylog
6171 1 administ S 3632 0.4 3 0.0 {uiDivStats} /bin/sh /jffs/scripts/uiDivStats querylog
20569 1 administ S 3632 0.4 0 0.0 {uiDivStats} /bin/sh /jffs/scripts/uiDivStats querylog
1866 1 administ S 3632 0.4 3 0.0 {uiDivStats} /bin/sh /jffs/scripts/uiDivStats querylog
10332 1 administ S 3632 0.4 1 0.0 {uiDivStats} /bin/sh /jffs/scripts/uiDivStats querylog
10054 1 administ S 3632 0.4 1 0.0 {uiDivStats} /bin/sh /jffs/scripts/uiDivStats querylog
30134 1 administ S 3632 0.4 0 0.0 {uiDivStats} /bin/sh /jffs/scripts/uiDivStats querylog
15493 1 administ S 3632 0.4 0 0.0 {uiDivStats} /bin/sh /jffs/scripts/uiDivStats querylog
2358 1 administ S 3632 0.4 1 0.0 {uiDivStats} /bin/sh /jffs/scripts/uiDivStats querylog
1532 1 administ S 3632 0.4 1 0.0 {uiDivStats} /bin/sh /jffs/scripts/uiDivStats querylog
18041 1 administ S 3632 0.4 2 0.0 {uiDivStats} /bin/sh /jffs/scripts/uiDivStats querylog
3489 1 administ S 3632 0.4 3 0.0 {uiDivStats} /bin/sh /jffs/scripts/uiDivStats querylog
701 1 administ S 3632 0.4 0 0.0 {uiDivStats} /bin/sh /jffs/scripts/uiDivStats querylog
7797 1 administ S 3632 0.4 3 0.0 {uiDivStats} /bin/sh /jffs/scripts/uiDivStats querylog
25754 1 administ S 3632 0.4 0 0.0 {uiDivStats} /bin/sh /jffs/scripts/uiDivStats querylog
15157 1 administ S 3632 0.4 3 0.0 {uiDivStats} /bin/sh /jffs/scripts/uiDivStats querylog
10692 1 administ S 3632 0.4 0 0.0 {uiDivStats} /bin/sh /jffs/scripts/uiDivStats querylog
4099 1 administ S 3632 0.4 1 0.0 {uiDivStats} /bin/sh /jffs/scripts/uiDivStats querylog
23859 1 administ S 3632 0.4 2 0.0 {uiDivStats} /bin/sh /jffs/scripts/uiDivStats querylog
28790 1 administ S 3632 0.4 0 0.0 {uiDivStats} /bin/sh /jffs/scripts/uiDivStats querylog
20836 1 administ S 3632 0.4 2 0.0 {uiDivStats} /bin/sh /jffs/scripts/uiDivStats querylog
24989 1 administ S 3632 0.4 1 0.0 {uiDivStats} /bin/sh /jffs/scripts/uiDivStats querylog
2897 1 administ S 3632 0.4 2 0.0 {uiDivStats} /bin/sh /jffs/scripts/uiDivStats querylog
32631 32630 administ S N 3632 0.4 0 0.0 {uiDivStats} /bin/sh /jffs/scripts/uiDivStats generate
5172 5170 administ S N 3500 0.3 3 0.0 {tailtop} /bin/sh /jffs/addons/scmerlin.d/tailtop
27488 2385 administ S 2504 0.2 1 0.0 dropbear -p 192.168.1.1:22 -a
1075 1 administ S 2392 0.2 1 0.0 /usr/sbin/haveged -r 0 -w 1024 -d 32 -i 32
7 2 administ SW 0 0.0 1 0.0 [rcu_preempt]
636 2 administ SW 0 0.0 0 0.0 [dhd_watchdog_th]
35 2 administ SW 0 0.0 1 0.0 [skb_free_task]
3 2 administ SW 0 0.0 0 0.0 [ksoftirqd/0]
3352 1 nobody S 24872 2.7 0 0.0 pixelserv-tls 192.168.1.3
1252 1 administ S 19780 2.1 3 0.0 roamast
2635 1 administ S 19404 2.1 1 0.0 wred -B
2375 1 administ S 18812 2.0 3 0.0 amas_lib
321 1 administ S 18524 2.0 0 0.0 /bin/swmdk
20518 1 administ S < 15760 1.7 1 0.0 dcd -i 3600 -p 43200 -b -d /tmp/bwdpi/
1254 1 administ S 13768 1.5 3 0.0 conn_diag
1070 1 administ S 13616 1.5 0 0.0 /sbin/netool
1 0 administ S 13308 1.4 2 0.0 /sbin/init
4913 1 administ S 13192 1.4 0 0.0 minidlna -f /etc/minidlna.conf -r
4287 1 nobody S 12560 1.3 0 0.0 dnsmasq --log-async
4906 1 administ S 11976 1.3 3 0.0 /usr/sbin/smbd -D -s /etc/smb.conf
4903 1 administ S 11856 1.3 2 0.0 /usr/sbin/nmbd -D -s /etc/smb.conf
1208 1175 administ S 11832 1.3 1 0.0 vis-dcon
1084 1 administ S 11632 1.2 3 0.0 nt_center
1044 1 administ S 11568 1.2 2 0.0 /sbin/wanduck
2627 1 administ S 11568 1.2 2 0.0 bwdpi_wred_alive
1255 1 administ S 11568 1.2 1 0.0 erp_monitor
2791 1 administ S 11568 1.2 2 0.0 usbled
1186 1 administ S 11568 1.2 2 0.0 amas_lanctrl
984 1 administ S 11568 1.2 0 0.0 /sbin/PS_pod
1223 1 administ S 11568 1.2 3 0.0 pctime
1182 1 administ S 11568 1.2 0 0.0 check_watchdog
887 1 administ S 11568 1.2 1 0.0 console
1122 1 administ S 11568 1.2 1 0.0 wpsaide
1219 1 administ S 11568 1.2 2 0.0 bwdpi_check
3044 1 administ S 11568 1.2 3 0.0 disk_monitor
4904 4903 administ S 11300 1.2 2 0.0 /usr/sbin/nmbd -D -s /etc/smb.conf
1173 1 administ S 11096 1.2 1 0.0 httpd -i br0
1172 1 administ S 10264 1.1 3 0.0 httpds -s -i br0 -p 8443
1063 1 administ S 8468 0.9 1 0.0 asd
1118 1 administ S 7976 0.8 3 0.0 hostapd -B /tmp/wl0_hapd.conf
 

Attachments

  • Capture.PNG
    Capture.PNG
    310.3 KB · Views: 86
RT-AX88U:/tmp/home/root# ps | grep "uiDivStats" | grep -cv "grep uiDivStats"
223

I indeed see a large amount of uidivstats entries, maybe its worthy to remove this ?
...
I don't have this uiDivStats add-on and know nothing about it, but I highly doubt that creating 223 processes is "normal" operating conditions. I'm wondering if it could be some rogue script/process/cronjob creating "uiDivStats" processes every "X" hours for some reason (likely some sort of bug, I strongly suspect).

If the number keeps increasing every day unrestrictedly, after a couple of weeks you could have thousands of these processes consuming a large portion of RAM, leaving barely enough memory for critical system services to do their job. Eventually, as the condition gets worse, this can lead to a significantly degraded system, then kernel errors being generated, and ultimately needing a reboot. It would be like a "slow death" within a few weeks if (as I suspect) the number of processes keeps increasing every day.

The way I see it, you have 2 options:

1) You can uninstall the add-on and, hopefully, that's the end of your problem.

2) Before you uninstall it, you could give a heads-up to the developer(s) and provide as much debugging info as you can so they can figure out the root cause of the problem. It could very well be a symptom of something else, but I imagine they might like to have some debug logs that the add-on perhaps generates on demand. At minimum, I'd send them the output of the top command so they can see the problem within the context of everything else that's running on your router at the time.

The following command will send the output to a file that you can provide:

top -b -n 1 > ./uiDivStats.TOP.log
 
its 4 Mb as of today, nothing remarkable.
Well, that's good. At least you've eliminated one possible source of the problem.

BTW, here's a small script that you could add as a cron job to gather data on the number of processes found every few hours. If you want, you could run it *ONLY* for a day or two (at most) just to check if more processes are being created each day; but then remember to remove the cron job.
Bash:
#!/bin/sh
## NumOfProcs_uiDivStats.sh ##
## To log some DEBUG Info WRT "uiDivStats" problem ##

# Create DEBUG log file on the Entware drive #
DEBUGdir="/opt/var/tmp"
if [ ! -d $DEBUGdir ] ; then mkdir -p $DEBUGdir ; fi
DEBUGfile="${DEBUGdir}/uiDivStats.DEBUG.log"

date >> $DEBUGfile
uptime >> $DEBUGfile
NumOfProcs="$(ps | grep "uiDivStats" | grep -cv "grep uiDivStats")"
echo "Process COUNT:[$NumOfProcs]" >> $DEBUGfile
top -b -n 1 | grep -E "^Mem:|^CPU:|^Load" >> $DEBUGfile
echo "" >> $DEBUGfile
exit
EDIT: Modified script to include additional router status info.

To run it as a cron job every 8 hours on the hour:
Bash:
cru a uiDivStatsDEBUG "0  */8  *  *  *  /jffs/scripts/NumOfProcs_uiDivStats.sh"

To run it as a cron job every 12 hours on the hour:
Bash:
cru a uiDivStatsDEBUG "0  */12  *  *  *  /jffs/scripts/NumOfProcs_uiDivStats.sh"
 
Last edited:
RT-AX88U:/tmp/home/root# ps | grep "uiDivStats" | grep -cv "grep uiDivStats"
223
I can barely read the contents of the screenshot you posted. And the output lines you copied/pasted are just an unformatted mess to read.

Could you post instead the output file generated as instructed previously?
Bash:
top -b -n 1 > ./uiDivStats.TOP.log

Also, out of curiosity, could you post the list of current cron jobs?
Bash:
date > ./CronJobsList.log ; cru l >> ./CronJobsList.log
Note: In "cru l" the parameter is a lower case L, *not* a number 1.
 
Last edited:
Just to share a possible comparison, I own an AX88U with Merlin FW-386.5 too and on it I run: diversion + skynet + uidivstats + suricata + scribe (w/ syslog-ng) + collectd (that's almost irrelevant).

The load average is about constant at 3.3. This is roughly the same I had with my previous AC86U running the same tools (always with the latest Merlin), the difference being that that sported a dual-core CPU with 512MB RAM which at least in theory would raise some perplexity for a load average well above 2, while the AX88U has double number of cores (4) and double RAM so the theory would suggest I should be fine. And since in practical terms I had no real troubles with the daily usage of the AC86U, I feel (and actually am) even more comfortable with the AX88U.

P.S. It should be noted that I have a 200/20 mbps WAN so the outer network performance seems not to be affected at all by this setup (there's more ... I'm in a double NAT environment with another firewall in front of the AX88U ...). I suppose that if I had a 1Gbps connection, then I would most probably experiment a bottleneck at the AX88U (and perhaps not only there, but I'll worry about this once it becomes reality).
 
Just to share a possible comparison, I own an AX88U with Merlin FW-386.5 too and on it I run: diversion + skynet + uidivstats + suricata + scribe (w/ syslog-ng) + collectd (that's almost irrelevant).

The load average is about constant at 3.3. This is roughly the same I had with my previous AC86U running the same tools (always with the latest Merlin), the difference being that that sported a dual-core CPU with 512MB RAM which at least in theory would raise some perplexity for a load average well above 2, while the AX88U has double number of cores (4) and double RAM so the theory would suggest I should be fine. And since in practical terms I had no real troubles with the daily usage of the AC86U, I feel (and actually am) even more comfortable with the AX88U.
...
Yeah, the scenario reported by @Sabbath81 must be an anomaly because there are likely many other users running the uiDivStats add-on without issues. Thank you for sharing your info for comparison.

Your load average of 3.3 looks good; on a quad-core CPU, anything under 4.0 is generally considered a good sign that your system is running well since all processes are able to get CPU time just as quickly as they needed it without waiting in the queue. That leads to good overall system performance.

Would you mind creating & running the following script on your router to gather some detailed info & compare it with the data from OP's router?
Bash:
#!/bin/sh
## NumOfProcs_uiDivStats.sh ##
## To log some DEBUG Info WRT "uiDivStats" problem ##

# Create DEBUG log file on the Entware drive #
DEBUGdir="/opt/var/tmp"
if [ ! -d $DEBUGdir ] ; then mkdir -p $DEBUGdir ; fi
DEBUGfile="${DEBUGdir}/uiDivStats.DEBUG.log"

date >> $DEBUGfile
uptime >> $DEBUGfile
NumOfProcs="$(ps | grep "uiDivStats" | grep -cv "grep uiDivStats")"
echo "Process COUNT:[$NumOfProcs]" >> $DEBUGfile
top -b -n 1 | grep -E "^Mem:|^CPU:|^Load" >> $DEBUGfile
echo "" >> $DEBUGfile
exit

To run the script once just type (using whatever name you give to the script) from within the directory where the script is stored on your router:
Bash:
dos2unix ./NumOfProcs_uiDivStats.sh
chmod a+x ./NumOfProcs_uiDivStats.sh
sh ./NumOfProcs_uiDivStats.sh

The output would be stored here (unless you change its location in the script):
Bash:
/opt/var/tmp/uiDivStats.DEBUG.log

I'm especially curious about the current number of uiDivStats processes running on your router & the router's overall status info (e.g. memory, CPU Utilization, CPU Load averages, uptime). This would give us a more realistic baseline of what "normal" operating conditions look like on the same model router under a similar situation as the OP's.

Again, thanks a lot.
 

Similar threads

Latest threads

Support SNBForums w/ Amazon

If you'd like to support SNBForums, just use this link and buy anything on Amazon. Thanks!

Sign Up For SNBForums Daily Digest

Get an update of what's new every day delivered to your mailbox. Sign up here!
Top