What's new

uiDivStats Stat generation times

  • SNBForums Code of Conduct

    SNBForums is a community for everyone, no matter what their level of experience.

    Please be tolerant and patient of others, especially newcomers. We are all here to share and learn!

    The rules are simple: Be patient, be nice, be helpful or be gone!

Jack Yaz

Part of the Furniture
Hi there,

I'm trying to find ways to improve the time taken for statistic generation to be completed. Please can people who are willing to test run the below command over SSH and share the output, including router model and firmware version?
Code:
time -v /jffs/scripts/uiDivStats generate
Please also post the size of your DNS database:
Code:
ls -hl /opt/share/uiDivStats.d/dnsqueries.db
RT-AX88U, Merlin 386.3 Alpha 1

Code:
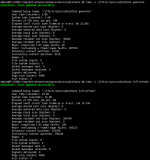
/tmp/home/root# time -v /jffs/scripts/uiDivStats generate
uiDivStats: Stats updated successfully

    Command being timed: "/jffs/scripts/uiDivStats generate"
    User time (seconds): 5.70
    System time (seconds): 2.46
    Percent of CPU this job got: 62%
    Elapsed (wall clock) time (h:mm:ss or m:ss): 0m 13.12s
    Average shared text size (kbytes): 0
    Average unshared data size (kbytes): 0
    Average stack size (kbytes): 0
    Average total size (kbytes): 0
    Maximum resident set size (kbytes): 36064
    Average resident set size (kbytes): 0
    Major (requiring I/O) page faults: 27
    Minor (reclaiming a frame) page faults: 527458
    Voluntary context switches: 19045
    Involuntary context switches: 10076
    Swaps: 0
    File system inputs: 0
    File system outputs: 0
    Socket messages sent: 0
    Socket messages received: 0
    Signals delivered: 0
    Page size (bytes): 4096
    Exit status: 0
/tmp/home/root# ls -hl /opt/share/uiDivStats.d/dnsqueries.db
-rw-r--r--    1 TheS1R   root        1.0G May 24 10:56 /opt/share/uiDivStats.d/dnsqueries.db
thanks! can you also try the below? this is the process that runs on a nightly basis so i'd recommend doing it when the network is quiet to avoid any issues
Code:
time -v /jffs/scripts/uiDivStats fullrefresh
 
Code:
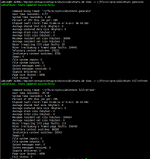
/tmp/home/root# time -v /jffs/scripts/uiDivStats fullrefresh
uiDivStats: Stats updated successfully

    Command being timed: "/jffs/scripts/uiDivStats fullrefresh"
    User time (seconds): 22.67
    System time (seconds): 4.79
    Percent of CPU this job got: 57%
    Elapsed (wall clock) time (h:mm:ss or m:ss): 0m 47.86s
    Average shared text size (kbytes): 0
    Average unshared data size (kbytes): 0
    Average stack size (kbytes): 0
    Average total size (kbytes): 0
    Maximum resident set size (kbytes): 113792
    Average resident set size (kbytes): 0
    Major (requiring I/O) page faults: 31
    Minor (reclaiming a frame) page faults: 596844
    Voluntary context switches: 42093
    Involuntary context switches: 17610
    Swaps: 0
    File system inputs: 0
    File system outputs: 0
    Socket messages sent: 0
    Socket messages received: 0
    Signals delivered: 0
    Page size (bytes): 4096
    Exit status: 0
those are ridiculously good times vs. my AC86U....
 
Here're mine, Jack:

Code:
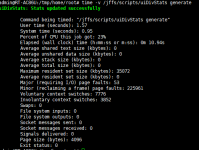
RT-AX86U:/jffs/scripts# time -v /jffs/scripts/uiDivStats generate

uiDivStats: Stats updated successfully

        Command being timed: "/jffs/scripts/uiDivStats generate"
        User time (seconds): 7.62
        System time (seconds): 2.60
        Percent of CPU this job got: 81%
        Elapsed (wall clock) time (h:mm:ss or m:ss): 0m 12.50s
        Average shared text size (kbytes): 0
        Average unshared data size (kbytes): 0
        Average stack size (kbytes): 0
        Average total size (kbytes): 0
        Maximum resident set size (kbytes): 29360
        Average resident set size (kbytes): 0
        Major (requiring I/O) page faults: 0
        Minor (reclaiming a frame) page faults: 462534
        Voluntary context switches: 11676
        Involuntary context switches: 9548
        Swaps: 0
        File system inputs: 0
        File system outputs: 0
        Socket messages sent: 0
        Socket messages received: 0
        Signals delivered: 0
        Page size (bytes): 4096
        Exit status: 0

Code:
ls -hl /opt/share/uiDivStats.d/dnsqueries.db
634.1M May 24 15:35 /opt/share/uiDivStats.d/dnsqueries.db

FWIW the "full refresh" showed a propensity for CPU1 or CPU4, with 2 & 3 largely idle.

Code:
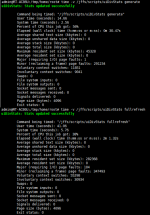
AX86U:/jffs/scripts# time -v /jffs/scripts/uiDivStats fullrefresh
uiDivStats: Stats updated successfully

        Command being timed: "/jffs/scripts/uiDivStats fullrefresh"
        User time (seconds): 46.40
        System time (seconds): 9.02
        Percent of CPU this job got: 54%
        Elapsed (wall clock) time (h:mm:ss or m:ss): 1m 42.56s
        Average shared text size (kbytes): 0
        Average unshared data size (kbytes): 0
        Average stack size (kbytes): 0
        Average total size (kbytes): 0
        Maximum resident set size (kbytes): 232288
        Average resident set size (kbytes): 0
        Major (requiring I/O) page faults: 23
        Minor (reclaiming a frame) page faults: 524290
        Voluntary context switches: 85635
        Involuntary context switches: 26394
        Swaps: 0
        File system inputs: 0
        File system outputs: 0
        Socket messages sent: 0
        Socket messages received: 0
        Signals delivered: 0
        Page size (bytes): 4096
        Exit status: 0
 
Hi there,

I'm trying to find ways to improve the time taken for statistic generation to be completed. Please can people who are willing to test run the below command over SSH and share the output, including router model and firmware version?
Code:
time -v /jffs/scripts/uiDivStats generate
Please also post the size of your DNS database:
Code:
ls -hl /opt/share/uiDivStats.d/dnsqueries.db
Hi,

I do not know how much it helps, but please find below my contribution:

Code:
time -v /jffs/scripts/uiDivStats generate
uiDivStats: Diversion logging not enabled!
uiDivStats: Open Diversion and use option l to enable logging
    Command being timed:  /jffs/scripts/uiDivStats generate 
    User time (seconds): 0.02
    System time (seconds): 0.01
    Percent of CPU this job got: 10%
    Elapsed (wall clock) time (h:mm:ss or m:ss): 0m 0.34s
    Average shared text size (kbytes): 0
    Average unshared data size (kbytes): 0
    Average stack size (kbytes): 0
    Average total size (kbytes): 0
    Maximum resident set size (kbytes): 7744
    Average resident set size (kbytes): 0
    Major (requiring I/O) page faults: 2
    Minor (reclaiming a frame) page faults: 2208
    Voluntary context switches: 45
    Involuntary context switches: 51
    Swaps: 0
    File system inputs: 0
    File system outputs: 0
    Socket messages sent: 0
    Socket messages received: 0
    Signals delivered: 0
    Page size (bytes): 4096
    Exit status: 0

ls -hl /opt/share/uiDivStats.d/dnsqueries.db
84.0M May  2 00:03 /opt/share/uiDivStats.d/dnsqueries.db

time -v /jffs/scripts/uiDivStats fullrefresh
uiDivStats: Diversion logging not enabled!
uiDivStats: Open Diversion and use option l to enable logging
    Command being timed:  /jffs/scripts/uiDivStats fullrefresh 
    User time (seconds): 0.01
    System time (seconds): 0.01
    Percent of CPU this job got: 80%
    Elapsed (wall clock) time (h:mm:ss or m:ss): 0m 0.03s
    Average shared text size (kbytes): 0
    Average unshared data size (kbytes): 0
    Average stack size (kbytes): 0
    Average total size (kbytes): 0
    Maximum resident set size (kbytes): 8400
    Average resident set size (kbytes): 0
    Major (requiring I/O) page faults: 0
    Minor (reclaiming a frame) page faults: 1834
    Voluntary context switches: 34
    Involuntary context switches: 35
    Swaps: 0
    File system inputs: 0
    File system outputs: 0
    Socket messages sent: 0
    Socket messages received: 0
    Signals delivered: 0
    Page size (bytes): 4096
    Exit status: 0

Model     RT-AX88U
Firmware Version     386.2_4
Firmware Build     Fri Apr 30 21:01:24 UTC 2021 merlin@71bcc40
Bootloader (CFE)     1.0.1.0

BR,
amplatfus
 
Hi,

I do not know how much it helps, but please find below my contribution:

Code:
time -v /jffs/scripts/uiDivStats generate
uiDivStats: Diversion logging not enabled!
uiDivStats: Open Diversion and use option l to enable logging
    Command being timed:  /jffs/scripts/uiDivStats generate
    User time (seconds): 0.02
    System time (seconds): 0.01
    Percent of CPU this job got: 10%
    Elapsed (wall clock) time (h:mm:ss or m:ss): 0m 0.34s
    Average shared text size (kbytes): 0
    Average unshared data size (kbytes): 0
    Average stack size (kbytes): 0
    Average total size (kbytes): 0
    Maximum resident set size (kbytes): 7744
    Average resident set size (kbytes): 0
    Major (requiring I/O) page faults: 2
    Minor (reclaiming a frame) page faults: 2208
    Voluntary context switches: 45
    Involuntary context switches: 51
    Swaps: 0
    File system inputs: 0
    File system outputs: 0
    Socket messages sent: 0
    Socket messages received: 0
    Signals delivered: 0
    Page size (bytes): 4096
    Exit status: 0

ls -hl /opt/share/uiDivStats.d/dnsqueries.db
84.0M May  2 00:03 /opt/share/uiDivStats.d/dnsqueries.db

time -v /jffs/scripts/uiDivStats fullrefresh
uiDivStats: Diversion logging not enabled!
uiDivStats: Open Diversion and use option l to enable logging
    Command being timed:  /jffs/scripts/uiDivStats fullrefresh
    User time (seconds): 0.01
    System time (seconds): 0.01
    Percent of CPU this job got: 80%
    Elapsed (wall clock) time (h:mm:ss or m:ss): 0m 0.03s
    Average shared text size (kbytes): 0
    Average unshared data size (kbytes): 0
    Average stack size (kbytes): 0
    Average total size (kbytes): 0
    Maximum resident set size (kbytes): 8400
    Average resident set size (kbytes): 0
    Major (requiring I/O) page faults: 0
    Minor (reclaiming a frame) page faults: 1834
    Voluntary context switches: 34
    Involuntary context switches: 35
    Swaps: 0
    File system inputs: 0
    File system outputs: 0
    Socket messages sent: 0
    Socket messages received: 0
    Signals delivered: 0
    Page size (bytes): 4096
    Exit status: 0

Model     RT-AX88U
Firmware Version     386.2_4
Firmware Build     Fri Apr 30 21:01:24 UTC 2021 merlin@71bcc40
Bootloader (CFE)     1.0.1.0

BR,
amplatfus
Diversion logging is showing disabled so no stats are being generated
 
Diversion logging is showing disabled so no stats are being generated
Yes, I know, but I was thinking to have as a reference point, how it looks in this case.
That was the reason I said maybe it helps to have a reference point.

BR,
amplatfus
 
AC-86U - 14 minutes 19 seconds is way way too long!!!!
Code:
uiDivStats: Stats updated successfully

        Command being timed: "/jffs/scripts/uiDivStats generate"
        User time (seconds): 6.37
        System time (seconds): 2.08
        Percent of CPU this job got: 22%
        Elapsed (wall clock) time (h:mm:ss or m:ss): 0m 37.73s
        Average shared text size (kbytes): 0
        Average unshared data size (kbytes): 0
        Average stack size (kbytes): 0
        Average total size (kbytes): 0
        Maximum resident set size (kbytes): 35632
        Average resident set size (kbytes): 0
        Major (requiring I/O) page faults: 31
        Minor (reclaiming a frame) page faults: 352966
        Voluntary context switches: 21842
        Involuntary context switches: 14743
        Swaps: 0
        File system inputs: 0
        File system outputs: 0
        Socket messages sent: 0
        Socket messages received: 0
        Signals delivered: 0
        Page size (bytes): 4096
        Exit status: 0
joescian@RT-AC86U-6440:/tmp/home/root#
joescian@RT-AC86U-6440:/tmp/home/root# ls -hl /opt/share/uiDivStats.d/dnsqueries.db
-rw-r--r--    1 joescian root      544.4M May 25 08:49 /opt/share/uiDivStats.d/dnsqueries.db

[CODE]uiDivStats: Stats updated successfully

        Command being timed: "/jffs/scripts/uiDivStats fullrefresh"
        User time (seconds): 48.02
        System time (seconds): 19.32
        Percent of CPU this job got: 7%
        Elapsed (wall clock) time (h:mm:ss or m:ss): 14m 18.58s
        Average shared text size (kbytes): 0
        Average unshared data size (kbytes): 0
        Average stack size (kbytes): 0
        Average total size (kbytes): 0
        Maximum resident set size (kbytes): 281920
        Average resident set size (kbytes): 0
        Major (requiring I/O) page faults: 1344
        Minor (reclaiming a frame) page faults: 429335
        Voluntary context switches: 440255
        Involuntary context switches: 118204
        Swaps: 0
        File system inputs: 0
        File system outputs: 0
        Socket messages sent: 0
        Socket messages received: 0
        Signals delivered: 0
        Page size (bytes): 4096
        Exit status: 0
 
Last edited:
Code:
joescian@RT-AX86U-AC30:/tmp/home/root# time -v /jffs/scripts/uiDivStats generate
uiDivStats: Stats updated successfully

        Command being timed: "/jffs/scripts/uiDivStats generate"
        User time (seconds): 5.16
        System time (seconds): 2.20
        Percent of CPU this job got: 85%
        Elapsed (wall clock) time (h:mm:ss or m:ss): 0m 8.62s
        Average shared text size (kbytes): 0
        Average unshared data size (kbytes): 0
        Average stack size (kbytes): 0
        Average total size (kbytes): 0
        Maximum resident set size (kbytes): 36032
        Average resident set size (kbytes): 0
        Major (requiring I/O) page faults: 0
        Minor (reclaiming a frame) page faults: 475124
        Voluntary context switches: 10807
        Involuntary context switches: 10922
        Swaps: 0
        File system inputs: 0
        File system outputs: 0
        Socket messages sent: 0
        Socket messages received: 0
        Signals delivered: 0
        Page size (bytes): 4096
        Exit status: 0
joescian@RT-AX86U-AC30:/tmp/home/root#

Code:
joescian@RT-AX86U-AC30:/tmp/home/root# ls -hl /opt/share/uiDivStats.d/dnsqueries
.db
-rw-r--r--    1 joescian root      405.7M May 25 09:10 /opt/share/uiDivStats.d/dnsqueries.db

Code:
uiDivStats: Stats updated successfully

        Command being timed: "/jffs/scripts/uiDivStats fullrefresh"
        User time (seconds): 30.98
        System time (seconds): 5.73
        Percent of CPU this job got: 36%
        Elapsed (wall clock) time (h:mm:ss or m:ss): 1m 39.73s
        Average shared text size (kbytes): 0
        Average unshared data size (kbytes): 0
        Average stack size (kbytes): 0
        Average total size (kbytes): 0
        Maximum resident set size (kbytes): 147504
        Average resident set size (kbytes): 0
        Major (requiring I/O) page faults: 44
        Minor (reclaiming a frame) page faults: 539803
        Voluntary context switches: 59619
        Involuntary context switches: 23011
        Swaps: 0
        File system inputs: 0
        File system outputs: 0
        Socket messages sent: 0
        Socket messages received: 0
        Signals delivered: 0
        Page size (bytes): 4096
        Exit status: 0
joescian@RT-AX86U-AC30:/tmp/home/root#

Wow - what a difference - 1:39 for AX86U and 14:19 for AC86U - wouldnt have expected that much difference
 
Last edited:
AC-86U - 14 minutes 19 seconds is way way too long!!!!
Code:
uiDivStats: Stats updated successfully

        Command being timed: "/jffs/scripts/uiDivStats generate"
        User time (seconds): 6.37
        System time (seconds): 2.08
        Percent of CPU this job got: 22%
        Elapsed (wall clock) time (h:mm:ss or m:ss): 0m 37.73s
        Average shared text size (kbytes): 0
        Average unshared data size (kbytes): 0
        Average stack size (kbytes): 0
        Average total size (kbytes): 0
        Maximum resident set size (kbytes): 35632
        Average resident set size (kbytes): 0
        Major (requiring I/O) page faults: 31
        Minor (reclaiming a frame) page faults: 352966
        Voluntary context switches: 21842
        Involuntary context switches: 14743
        Swaps: 0
        File system inputs: 0
        File system outputs: 0
        Socket messages sent: 0
        Socket messages received: 0
        Signals delivered: 0
        Page size (bytes): 4096
        Exit status: 0
joescian@RT-AC86U-6440:/tmp/home/root#
joescian@RT-AC86U-6440:/tmp/home/root# ls -hl /opt/share/uiDivStats.d/dnsqueries.db
-rw-r--r--    1 joescian root      544.4M May 25 08:49 /opt/share/uiDivStats.d/dnsqueries.db

[CODE]uiDivStats: Stats updated successfully

        Command being timed: "/jffs/scripts/uiDivStats fullrefresh"
        User time (seconds): 48.02
        System time (seconds): 19.32
        Percent of CPU this job got: 7%
        Elapsed (wall clock) time (h:mm:ss or m:ss): 14m 18.58s
        Average shared text size (kbytes): 0
        Average unshared data size (kbytes): 0
        Average stack size (kbytes): 0
        Average total size (kbytes): 0
        Maximum resident set size (kbytes): 281920
        Average resident set size (kbytes): 0
        Major (requiring I/O) page faults: 1344
        Minor (reclaiming a frame) page faults: 429335
        Voluntary context switches: 440255
        Involuntary context switches: 118204
        Swaps: 0
        File system inputs: 0
        File system outputs: 0
        Socket messages sent: 0
        Socket messages received: 0
        Signals delivered: 0
        Page size (bytes): 4096
        Exit status: 0
well, the good news is these numbers correlate with my AC86U so you're not alone....
 
ASUSWRT-Merlin RT-AC86U 386.2_4
Another AC86U, 3 min not too shabby eh? Not sure why the DB size has capped at this size of about 330MB for some time and not growing anymore.

Code:
admin@RT-AC86U-DBA8:/# time -v /jffs/scripts/uiDivStats generate
uiDivStats: Stats updated successfully

        Command being timed: "/jffs/scripts/uiDivStats generate"
        User time (seconds): 3.78
        System time (seconds): 0.66
        Percent of CPU this job got: 31%
        Elapsed (wall clock) time (h:mm:ss or m:ss): 0m 14.18s
        Average shared text size (kbytes): 0
        Average unshared data size (kbytes): 0
        Average stack size (kbytes): 0
        Average total size (kbytes): 0
        Maximum resident set size (kbytes): 36032
        Average resident set size (kbytes): 0
        Major (requiring I/O) page faults: 35
        Minor (reclaiming a frame) page faults: 214230
        Voluntary context switches: 18634
        Involuntary context switches: 17410
        Swaps: 0
        File system inputs: 0
        File system outputs: 0
        Socket messages sent: 0
        Socket messages received: 0
        Signals delivered: 0
        Page size (bytes): 4096
        Exit status: 0
admin@RT-AC86U-DBA8:/# ls -hl /opt/share/uiDivStats.d/dnsqueries.db
-rw-r--r--    1 admin    root      321.7M May 25 18:37 /opt/share/uiDivStats.d/dnsqueries.db
admin@RT-AC86U-DBA8:/# time -v /jffs/scripts/uiDivStats fullrefresh
uiDivStats: Stats updated successfully

        Command being timed: "/jffs/scripts/uiDivStats fullrefresh"
        User time (seconds): 18.02
        System time (seconds): 5.24
        Percent of CPU this job got: 11%
        Elapsed (wall clock) time (h:mm:ss or m:ss): 3m 18.40s
        Average shared text size (kbytes): 0
        Average unshared data size (kbytes): 0
        Average stack size (kbytes): 0
        Average total size (kbytes): 0
        Maximum resident set size (kbytes): 105280
        Average resident set size (kbytes): 0
        Major (requiring I/O) page faults: 89
        Minor (reclaiming a frame) page faults: 268011
        Voluntary context switches: 95662
        Involuntary context switches: 72214
        Swaps: 0
        File system inputs: 0
        File system outputs: 0
        Socket messages sent: 0
        Socket messages received: 0
        Signals delivered: 0
        Page size (bytes): 4096
        Exit status: 0
admin@RT-AC86U-DBA8:/#
 
Last edited:
I've been dabbling with some more targeted indexes to improve query performance, some promising results so far. My db is about 1gb with 30days data.
Before (current):
old index.PNG
After (with new indexes):
new index.PNG
 
Hi there,

I'm trying to find ways to improve the time taken for statistic generation to be completed. Please can people who are willing to test run the below command over SSH and share the output, including router model and firmware version?
Code:
time -v /jffs/scripts/uiDivStats generate
Please also post the size of your DNS database:
Code:
ls -hl /opt/share/uiDivStats.d/dnsqueries.db
Another RT-AX86U / 386.2_4 fw

Code:
ASUSWRT-Merlin RT-AX86U 386.2_4 Fri Apr 30 21:00:24 UTC 2021
admin@RT-AX86U:/tmp/home/root# time -v /jffs/scripts/uiDivStats generate
uiDivStats: Stats updated successfully

    Command being timed: "/jffs/scripts/uiDivStats generate"
    User time (seconds): 6.16
    System time (seconds): 2.35
    Percent of CPU this job got: 72%
    Elapsed (wall clock) time (h:mm:ss or m:ss): 0m 11.68s
    Average shared text size (kbytes): 0
    Average unshared data size (kbytes): 0
    Average stack size (kbytes): 0
    Average total size (kbytes): 0
    Maximum resident set size (kbytes): 36192
    Average resident set size (kbytes): 0
    Major (requiring I/O) page faults: 3
    Minor (reclaiming a frame) page faults: 382728
    Voluntary context switches: 8773
    Involuntary context switches: 14701
    Swaps: 0
    File system inputs: 0
    File system outputs: 0
    Socket messages sent: 0
    Socket messages received: 0
    Signals delivered: 0
    Page size (bytes): 4096
    Exit status: 0

Code:
admin@RT-AX86U:/tmp/home/root# ls -hl /opt/share/uiDivStats.d/dnsqueries.db
-rw-r--r--    1 admin    root      253.9M May 26 10:17 /opt/share/uiDivStats.d/dnsqueries.db

Code:
admin@RT-AX86U:/tmp/home/root# time -v /jffs/scripts/uiDivStats fullrefresh
uiDivStats: Stats updated successfully

    Command being timed: "/jffs/scripts/uiDivStats fullrefresh"
    User time (seconds): 31.35
    System time (seconds): 6.56
    Percent of CPU this job got: 53%
    Elapsed (wall clock) time (h:mm:ss or m:ss): 1m 11.22s
    Average shared text size (kbytes): 0
    Average unshared data size (kbytes): 0
    Average stack size (kbytes): 0
    Average total size (kbytes): 0
    Maximum resident set size (kbytes): 146656
    Average resident set size (kbytes): 0
    Major (requiring I/O) page faults: 0
    Minor (reclaiming a frame) page faults: 453128
    Voluntary context switches: 33319
    Involuntary context switches: 31705
    Swaps: 0
    File system inputs: 0
    File system outputs: 0
    Socket messages sent: 0
    Socket messages received: 0
    Signals delivered: 0
    Page size (bytes): 4096
    Exit status: 0
 
I've been watching this file a while and using AMTM + Tooling since it was first delivered. Jack, any DB maint planned or happening WRT size / pruning by date or age? I'm asking b/c this seems a bit large and maybe needs pruning by date? The GUI basically stopped displaying anything. I'm running on our fastest USB/SATA/SSD + latest AMTM etc... I deleted the large DB a few days ago (sorry) but here's how big it had grown.

Sorry I thought I' had saved my updated post with the commands you wanted, (with the much smaller file now) but I never hit enter.

Running 386.2_4 Merlin on an RT-AX86U

1622119416840.png


Here's stats from today with a much smaller DB....
time -v /jffs/scripts/uiDivStats generate
uiDivStats: Stats updated successfully

Command being timed: "/jffs/scripts/uiDivStats generate"
User time (seconds): 18.58
System time (seconds): 5.09
Percent of CPU this job got: 96%
Elapsed (wall clock) time (h:mm:ss or m:ss): 0m 24.47s
Average shared text size (kbytes): 0
Average unshared data size (kbytes): 0
Average stack size (kbytes): 0
Average total size (kbytes): 0
Maximum resident set size (kbytes): 35600
Average resident set size (kbytes): 0
Major (requiring I/O) page faults: 0
Minor (reclaiming a frame) page faults: 128224
Voluntary context switches: 2471
Involuntary context switches: 4447
Swaps: 0
File system inputs: 0
File system outputs: 0
Socket messages sent: 0
Socket messages received: 0
Signals delivered: 0
Page size (bytes): 4096
Exit status: 0

ls -hl /opt/share/uiDivStats.d/dnsqueries.db
-rw-r--r-- xxxxx 17.8M May 27 08:56 /opt/share/uiDivStats.d/dnsqueries.db

time -v /jffs/scripts/uiDivStats fullrefresh
uiDivStats: Stats updated successfully

Command being timed: "/jffs/scripts/uiDivStats fullrefresh"
User time (seconds): 26.65
System time (seconds): 6.00
Percent of CPU this job got: 96%
Elapsed (wall clock) time (h:mm:ss or m:ss): 0m 33.81s
Average shared text size (kbytes): 0
Average unshared data size (kbytes): 0
Average stack size (kbytes): 0
Average total size (kbytes): 0
Maximum resident set size (kbytes): 65360
Average resident set size (kbytes): 0
Major (requiring I/O) page faults: 0
Minor (reclaiming a frame) page faults: 174194
Voluntary context switches: 3400
Involuntary context switches: 8698
Swaps: 0
File system inputs: 0
File system outputs: 0
Socket messages sent: 0
Socket messages received: 0
Signals delivered: 0
Page size (bytes): 4096
Exit status: 0
<EOF>
 
Last edited:

Similar threads

Latest threads

Sign Up For SNBForums Daily Digest

Get an update of what's new every day delivered to your mailbox. Sign up here!
Top