What's new
  • SNBForums Code of Conduct

    SNBForums is a community for everyone, no matter what their level of experience.

    Please be tolerant and patient of others, especially newcomers. We are all here to share and learn!

    The rules are simple: Be patient, be nice, be helpful or be gone!

FlexQoS FlexQoS issues with 388.4 HND5.04 models

Any old timers know what this means, especially at 5108?
Code:
0000000000005000 <fc_hook_cb>:
    5000:       a9af7bfd        stp     x29, x30, [sp, #-272]!
    5004:       910003fd        mov     x29, sp
    5008:       f9000bf3        str     x19, [sp, #16]
    500c:       90000013        adrp    x19, 0 <__stack_chk_guard>
    5010:       91000273        add     x19, x19, #0x0
    5014:       b90027ff        str     wzr, [sp, #36]
    5018:       f9400262        ldr     x2, [x19]
    501c:       f90087e2        str     x2, [sp, #264]
    5020:       d2800002        mov     x2, #0x0                        // #0
    5024:       b4000a00        cbz     x0, 5164 <fc_hook_cb+0x164>
    5028:       90000003        adrp    x3, 100 <forward_find_ct_by_tuples+0x100>
    502c:       91000063        add     x3, x3, #0x0
    5030:       aa0003e2        mov     x2, x0
    5034:       aa0103e4        mov     x4, x1
    5038:       91006063        add     x3, x3, #0x18
    503c:       90000001        adrp    x1, 100 <forward_find_ct_by_tuples+0x100>
    5040:       91000021        add     x1, x1, #0x0
    5044:       52800020        mov     w0, #0x1                        // #1
    5048:       94000000        bl      0 <__ll_sc_atomic_add>
    504c:       a902ffff        stp     xzr, xzr, [sp, #40]
    5050:       92400440        and     x0, x2, #0x3
    5054:       f1000c1f        cmp     x0, #0x3
    5058:       a903ffff        stp     xzr, xzr, [sp, #56]
    505c:       a904ffff        stp     xzr, xzr, [sp, #72]
    5060:       a905ffff        stp     xzr, xzr, [sp, #88]
    5064:       a906ffff        stp     xzr, xzr, [sp, #104]
    5068:       a907ffff        stp     xzr, xzr, [sp, #120]
    506c:       a908ffff        stp     xzr, xzr, [sp, #136]
    5070:       a909ffff        stp     xzr, xzr, [sp, #152]
    5074:       a90affff        stp     xzr, xzr, [sp, #168]
    5078:       a90bffff        stp     xzr, xzr, [sp, #184]
    507c:       a90cffff        stp     xzr, xzr, [sp, #200]
    5080:       a90dffff        stp     xzr, xzr, [sp, #216]
    5084:       a90effff        stp     xzr, xzr, [sp, #232]
    5088:       a90fffff        stp     xzr, xzr, [sp, #248]
    508c:       540004e0        b.eq    5128 <fc_hook_cb+0x128>  // b.none
    5090:       f9403041        ldr     x1, [x2, #96]
    5094:       b25963e0        mov     x0, #0xffffff8000000000         // #-549755813888
    5098:       eb00003f        cmp     x1, x0
    509c:       54000368        b.hi    5108 <fc_hook_cb+0x108>  // b.pmore
    50a0:       52800000        mov     w0, #0x0                        // #0
    50a4:       d2800005        mov     x5, #0x0                        // #0
    50a8:       52800002        mov     w2, #0x0                        // #0
    50ac:       b941f887        ldr     w7, [x4, #504]
    50b0:       32000006        orr     w6, w0, #0x1
    50b4:       121f7801        and     w1, w0, #0xfffffffe
    50b8:       910093e4        add     x4, sp, #0x24
    50bc:       528000a3        mov     w3, #0x5                        // #5
    50c0:       9100a3e0        add     x0, sp, #0x28
    50c4:       f24000ff        tst     x7, #0x1
    50c8:       f9003fe5        str     x5, [sp, #120]
    50cc:       1a860021        csel    w1, w1, w6, eq  // eq = none
    50d0:       290a0be1        stp     w1, w2, [sp, #80]
    50d4:       f9004be4        str     x4, [sp, #144]
    50d8:       b900bbe3        str     w3, [sp, #184]
    50dc:       94000000        bl      0 <udb_shell_do_fastpath_action>
    50e0:       7100001f        cmp     w0, #0x0
    50e4:       52800061        mov     w1, #0x3                        // #3
    50e8:       1a9f0020        csel    w0, w1, wzr, eq  // eq = none
    50ec:       f94087e2        ldr     x2, [sp, #264]
    50f0:       f9400261        ldr     x1, [x19]
    50f4:       ca010041        eor     x1, x2, x1
    50f8:       b5000341        cbnz    x1, 5160 <fc_hook_cb+0x160>
    50fc:       f9400bf3        ldr     x19, [sp, #16]
    5100:       a8d17bfd        ldp     x29, x30, [sp], #272
    5104:       d65f03c0        ret
    5108:       b9406c20        ldr     w0, [x1, #108]
    510c:       91018045        add     x5, x2, #0x60
    5110:       b9006040        str     w0, [x2, #96]
    5114:       b9405842        ldr     w2, [x2, #88]
    5118:       52800000        mov     w0, #0x0                        // #0
    511c:       b9410821        ldr     w1, [x1, #264]
    5120:       b90027e1        str     w1, [sp, #36]
    5124:       17ffffe2        b       50ac <fc_hook_cb+0xac>
    5128:       927ef442        and     x2, x2, #0xfffffffffffffffc
    512c:       b25963e1        mov     x1, #0xffffff8000000000         // #-549755813888
    5130:       f9401040        ldr     x0, [x2, #32]
    5134:       eb01001f        cmp     x0, x1
    5138:       54fffb49        b.ls    50a0 <fc_hook_cb+0xa0>  // b.plast
    513c:       b9406c01        ldr     w1, [x0, #108]
    5140:       91008045        add     x5, x2, #0x20
    5144:       f9001041        str     x1, [x2, #32]
    5148:       b9401842        ldr     w2, [x2, #24]
    514c:       b9410800        ldr     w0, [x0, #264]
    5150:       b90027e0        str     w0, [sp, #36]
    5154:       d3405c42        ubfx    x2, x2, #0, #24
    5158:       b94053e0        ldr     w0, [sp, #80]
    515c:       17ffffd4        b       50ac <fc_hook_cb+0xac>
    5160:       94000000        bl      0 <__stack_chk_fail>
    5164:       90000000        adrp    x0, 0 <forward_find_ct_by_tuples>
    5168:       91000000        add     x0, x0, #0x0
    516c:       94000000        bl      0 <printk>
    5170:       52800000        mov     w0, #0x0                        // #0
    5174:       17ffffde        b       50ec <fc_hook_cb+0xec>
    5178:       d503201f        nop
    517c:       d503201f        nop
I am not an oldtimer nor do I understand reading this stuff, but here is what ChatGPT says.

The instruction b9406c20 is an ARM64 instruction that loads a 32-bit (4-byte) word from memory into the W0 register. The specific addressing mode used here is [x1, #108], which means it is attempting to load a 32-bit word from the memory location pointed to by register X1 plus an offset of 108 bytes.
The instruction itself appears to be correct in terms of its syntax. However, what's "wrong" with it depends on the context of your code and the intended purpose of this operation. Here are some considerations:
  1. Memory Access: Make sure that the memory location [x1, #108] is valid and accessible. If x1 doesn't point to a valid memory location, or if the offset of 108 bytes goes beyond the boundaries of the memory region pointed to by x1, it could lead to memory access violations.
  2. Data Alignment: In ARM64, memory access operations often require proper data alignment. Ensure that the memory location pointed to by x1 is properly aligned for a 32-bit load operation. Unaligned memory accesses can lead to performance penalties or even crashes on some architectures.
  3. Register Usage: Be aware of the intended use of the data loaded into w0 and make sure it aligns with the logic of your program. If the data is supposed to be used elsewhere in the code, verify that it's used correctly.
  4. Error Handling: Depending on the context, you may want to check for errors or exceptions related to this memory access. For example, you might want to add code to handle cases where the memory access fails.
To determine what's specifically "wrong" with this instruction, you'll need to consider the larger context of your code, such as the values in registers (x1 in this case) and the purpose of the loaded data. Additionally, you should verify that the memory access is within bounds and properly aligned.

But you cannot go by the reliability of chatgpt. I wonder if @RMerlin understands any of this stuff, or @dave14305 for that matter..
 
We at least can see the kernel panic details now. Thanks for that. bcmsw_rx seems to crash with a very flowcache-y call stack. I’m not an expert at reading these, but not surprising that a lot of closed-source modules are mentioned.
Code:
May  5 08:05:09 crashlog: <4> [last unloaded: tdts]
May  5 08:05:09 crashlog: <0>Process bcmsw_rx (pid: 409, stack limit = 0x000000007db6c041)
May  5 08:05:09 crashlog: <4>CPU: 0 PID: 409 Comm: bcmsw_rx Tainted: P           O      4.19.183 #1
May  5 08:05:09 crashlog: <4>Hardware name: RTAX86U_PRO (DT)
May  5 08:05:09 crashlog: <4>pstate: 20000005 (nzCv daif -PAN -UAO)
May  5 08:05:09 crashlog: <4>pc : fc_hook_cb+0x108/0x180 [tdts_udbfw]
May  5 08:05:09 crashlog: <4>lr : fc_hook_cb+0x4c/0x180 [tdts_udbfw]
May  5 08:05:09 crashlog: <4>sp : ffffff801770b530
May  5 08:05:09 crashlog: <4>x29: ffffff801770b530 x28: ffffffc02d14b98e
May  5 08:05:09 crashlog: <4>x27: 0000000000000000 x26: 0000000000000000
May  5 08:05:09 crashlog: <4>x25: 000000402c57d000 x24: ffffff8008a90000
May  5 08:05:09 crashlog: <4>x23: ffffffc026987840 x22: ffffffc026987000
May  5 08:05:09 crashlog: <4>x21: ffffff80089c9948 x20: ffffffc01ddae800
May  5 08:05:09 crashlog: <4>x19: ffffff80089c9948 x18: 0000000000000001
May  5 08:05:09 crashlog: <4>x17: 0000000000000000 x16: 000000000102340f
May  5 08:05:09 crashlog: <4>x15: 0000000000000000 x14: 0000000000004900
May  5 08:05:09 crashlog: <4>x13: 0000000000000001 x12: 000000000000008c
May  5 08:05:09 crashlog: <4>x11: 0000000000000000 x10: 0000000000000001
May  5 08:05:09 crashlog: <4>x9 : 0000000000000000 x8 : ffffffc01ddae9e8
May  5 08:05:09 crashlog: <4>x7 : 0000000000000000 x6 : 00000000000000b2
May  5 08:05:09 crashlog: <4>x5 : 0000000000000040 x4 : ffffffc026987000
May  5 08:05:09 crashlog: <4>x3 : ffffff8000ff2660 x2 : ffffffc01ddae800
May  5 08:05:09 crashlog: <4>x1 : ffffffc094c6ffff x0 : ffffff8000000000
May  5 08:05:09 crashlog: <4>Call trace:
May  5 08:05:09 crashlog: <4> fc_hook_cb+0x108/0x180 [tdts_udbfw]
May  5 08:05:09 crashlog: <4> br_dev_xmit+0x1c0/0x3c0
May  5 08:05:09 crashlog: <4> fc_dev_xmit+0x88/0x100 [pktflow]
May  5 08:05:09 crashlog: <4> fc_queue_fkb+0x2c/0x40 [pktflow]
May  5 08:05:09 crashlog: <4> fc_stack_pkt+0x290/0x8500 [pktflow]
May  5 08:05:09 crashlog: <4> fc_stack_ucast+0xd4/0x150 [pktflow]
May  5 08:05:09 crashlog: <4> fc_stack+0x6c/0x80 [pktflow]
May  5 08:05:09 crashlog: <4> fc_receive+0x2c24/0x53c0 [pktflow]
May  5 08:05:09 crashlog: <4> _blog_finit+0x130/0x2a0
May  5 08:05:09 crashlog: <4> chan_thread_handler+0x274/0x790 [bcm_enet]
May  5 08:05:09 crashlog: <4> kthread+0x118/0x150
May  5 08:05:09 crashlog: <4> ret_from_fork+0x10/0x24
May  5 08:05:09 crashlog: <0>Code: b5000341 f9400bf3 a8d17bfd d65f03c0 (b9406c20)
May  5 08:05:09 crashlog: <4>---[ end trace 35c408fe1097d635 ]---
May  5 08:05:09 crashlog: <0>Kernel panic - not syncing: Fatal exception
May  5 08:05:09 crashlog: <2>SMP: stopping secondary CPUs
May  5 08:05:09 crashlog: <0>Kernel Offset: disabled
May  5 08:05:09 crashlog: <0>CPU features: 0x0,24802004
May  5 08:05:09 crashlog: <0>Memory Limit: none
May  5 08:05:09 crashlog: ?????????????????
according to chatgpt, here is abit about the "call trace" on this log read.

Certainly, let's take a closer look at the "Call trace" section of the crash log. The call trace provides a sequence of function calls that occurred leading up to the kernel panic. Each entry in the call trace represents a function or method from different parts of the kernel or kernel modules. Understanding the call trace can help identify which code paths were active when the crash occurred, but without access to the source code, it may not pinpoint the exact cause. Here's a breakdown of the call trace entries:

  1. fc_hook_cb+0x108/0x180 [tdts_udbfw]:
    • The crash likely started in the function fc_hook_cb within the tdts_udbfw module.
    • The offset 0x108 represents the memory location within the function where the crash occurred.
    • The /0x180 indicates the total size of the function in memory.
  2. br_dev_xmit+0x1c0/0x3c0:
    • After the crash in fc_hook_cb, the kernel appears to have called the function br_dev_xmit.
    • The offset 0x1c0 indicates the location within the br_dev_xmit function where the crash occurred.
    • The /0x3c0 indicates the total size of the br_dev_xmit function in memory.
  3. fc_dev_xmit+0x88/0x100 [pktflow]:
    • Next, there's a call to the function fc_dev_xmit within the pktflow module.
    • The offset 0x88 shows where the crash occurred within this function.
    • The /0x100 represents the total size of the fc_dev_xmit function.
  4. fc_queue_fkb+0x2c/0x40 [pktflow]:
    • This entry indicates a function call to fc_queue_fkb within the pktflow module.
    • The offset 0x2c shows the location of the crash within this function.
    • The /0x40 represents the total size of the fc_queue_fkb function.
  5. fc_stack_pkt+0x290/0x8500 [pktflow]:
    • Another function call is made to fc_stack_pkt within the pktflow module.
    • The offset 0x290 indicates where the crash occurred within this function.
    • The /0x8500 is the total size of the fc_stack_pkt function.
  6. fc_stack_ucast+0xd4/0x150 [pktflow]:
    • There's a call to fc_stack_ucast within the pktflow module.
    • The offset 0xd4 shows the crash location within this function.
    • The /0x150 represents the total size of the fc_stack_ucast function.
  7. fc_stack+0x6c/0x80 [pktflow]:
    • This entry shows a call to the fc_stack function within the pktflow module.
    • The offset 0x6c points to where the crash occurred within this function.
    • The /0x80 is the total size of the fc_stack function.
  8. fc_receive+0x2c24/0x53c0 [pktflow]:
    • Finally, there's a call to fc_receive within the pktflow module.
    • The offset 0x2c24 indicates where the crash occurred within this function.
    • The /0x53c0 represents the total size of the fc_receive function.
Understanding the call trace helps identify the sequence of events leading up to the crash. In this case, it seems that the crash occurred during network-related operations involving functions from various kernel modules, including tdts_udbfw and pktflow. Further investigation would require access to the source code of these modules and potentially debugging tools to identify the root cause of the crash within these functions.
 
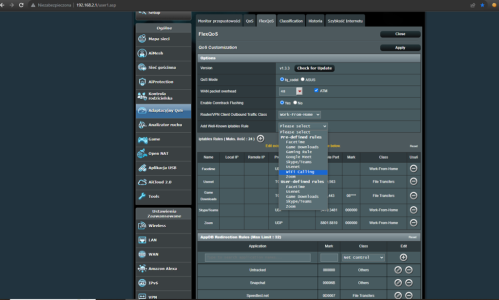
That’s a nice, specific reproducer of the problem. Was it just the default WiFi Calling rule, or had you customized it at all?
This was the default WIFI rule.
I noticed something about syn flood in the logs... 2-3 lines when I received or made a call via WIFI... then reboot.
Unfortunately, I had to remove this rule so that the router would not restart when using mobile phones.

Regards, Marcin.
 

Attachments

  • default wifi rule.png
    default wifi rule.png
    196.7 KB · Views: 55
Unfortunately, I had to remove this rule so that the router would not restart when using mobile phones.
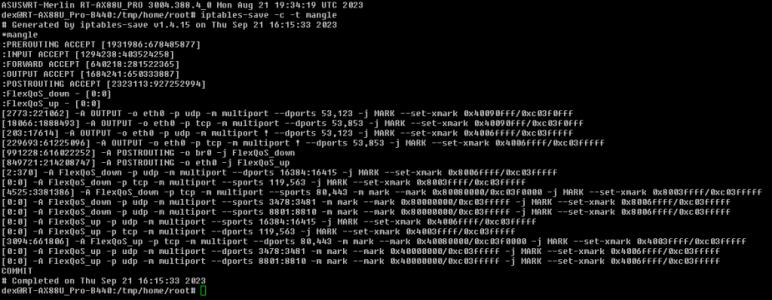
Would you please share the output of this command to see the remaining rules?
Code:
iptables-save -c -t mangle
 
They should rename ChatGPT to “Sherlock” as in “No sh!t Sherlock!”
I agree. It is definitely the next Sherlock, Albert Einstein, Dick Tracy, Nancy Drew, or Captain Obvious. Choose your poison wisely. I was hoping one of the fossils or relic around here would actually show up with something useful, but I see that is like trying to talk with someone trapped in a wind tunnel.
 
Last edited:
Yes, please see the attachment.
That’s very interesting. Other tcp-based rules don’t seem to cause reboots, but the udp rule does. However, it seems you had 2 packets for the FaceTime rule, but only in the download direction, nothing on upload.

Maybe it’s a problem with marking udp packets on upload.

Would you be willing to insert this logging rule (which should not cause a reboot) and repeat the phone call test (briefly)? Then get the log messages from syslog and post the text here or on pastebin.com. If there are any sensitive IPs, you can redact them. I’m mostly interested in the MARK= portion of each line.
Code:
iptables -t mangle -I FlexQoS_up -p udp -m multiport --dports 500,4500 -j LOG --log-prefix "[FlexQoS Debug] " --log-tcp-options --log-ip-options

You can remove the logging rule with:
Code:
iptables -t mangle -D FlexQoS_up -p udp -m multiport --dports 500,4500 -j LOG --log-prefix "[FlexQoS Debug] " --log-tcp-options --log-ip-options
 
Last edited:
That’s very interesting. Other tcp-based rules don’t seem to cause reboots, but the udp rule does. However, it seems you had 2 packets for the FaceTime rule, but only in the download direction, nothing on upload.

Maybe it’s a problem with marking udp packets on upload.

Would you be willing to insert this logging rule (which should not cause a reboot) and repeat the phone call test (briefly)? Then get the log messages from syslog and post the text here or on pastebin.com. If there are any sensitive IPs, you can redact them. I’m mostly interested in the MARK= portion of each line.
Code:
iptables -t mangle -I FlexQoS_up -p udp -m multiport -dports 500,4500 -j LOG --log-prefix "[FlexQoS Debug] " --log-tcp-options --log-ip-options

You can remove the logging rule with:
Code:
iptables -t mangle -D FlexQoS_up -p udp -m multiport -dports 500,4500 -j LOG --log-prefix "[FlexQoS Debug] " --log-tcp-options --log-ip-options
Hi, got an error ..
Bad argument `500,4500'
Try `iptables -h' or 'iptables --help' for more information.

I removed the rule for FaceTime and added the one for Wifi Calling and it restarts during a phone call.

Please check this iptables rule for logging and I will try to test again.

Best Regards, Marcin.
 
Last edited:
Was this with the WiFi Calling rule still active? I’d prefer you run the logs with that rule deleted from the GUI. No need to keep rebooting for this log gathering.
Yes, I triggered this rule during this test. It was still active and therefore the router was restarted. I will then try to test again, but with the WIFI CALLING rule disabled in the GUI.

Code:
Sep 21 19:43:05 kernel: [FlexQoS Debug] IN= OUT=eth0 SRC=192.168.2.253 DST=89.108.200.112 LEN=29 TOS=0x00 PREC=0x00 TTL=63 ID=0 PROTO=UDP SPT=40110 DPT=4500 LEN=9 MARK=0x40cb0042
Sep 21 19:43:06 kernel: [FlexQoS Debug] IN= OUT=eth0 SRC=192.168.2.253 DST=89.108.200.112 LEN=112 TOS=0x00 PREC=0x00 TTL=253 ID=12066 DF PROTO=UDP SPT=40110 DPT=4500 LEN=92 MARK=0x40cb0042
Sep 21 19:43:25 kernel: [FlexQoS Debug] IN= OUT=eth0 SRC=192.168.2.253 DST=89.108.200.112 LEN=1140 TOS=0x00 PREC=0x00 TTL=63 ID=31044 PROTO=UDP SPT=40110 DPT=4500 LEN=1120 MARK=0x40cb0042
Sep 21 19:43:25 kernel: [FlexQoS Debug] IN= OUT=eth0 SRC=192.168.2.253 DST=89.108.200.112 LEN=1140 TOS=0x00 PREC=0x00 TTL=63 ID=31045 PROTO=UDP SPT=40110 DPT=4500 LEN=1120 MARK=0x40cb0042
Sep 21 19:43:25 kernel: [FlexQoS Debug] IN= OUT=eth0 SRC=192.168.2.253 DST=89.108.200.112 LEN=660 TOS=0x00 PREC=0x00 TTL=63 ID=31046 PROTO=UDP SPT=40110 DPT=4500 LEN=640 MARK=0x40cb0042
Sep 21 19:43:25 kernel: [FlexQoS Debug] IN= OUT=eth0 SRC=192.168.2.253 DST=89.108.200.112 LEN=180 TOS=0x00 PREC=0x00 TTL=63 ID=31052 PROTO=UDP SPT=40110 DPT=4500 LEN=160 MARK=0x40cb0042
Sep 21 19:43:25 kernel: [FlexQoS Debug] IN= OUT=eth0 SRC=192.168.2.253 DST=89.108.200.112 LEN=29 TOS=0x00 PREC=0x00 TTL=63 ID=0 PROTO=UDP SPT=40110 DPT=4500 LEN=9 MARK=0x40cb0042
Sep 21 19:43:26 kernel: [FlexQoS Debug] IN= OUT=eth0 SRC=192.168.2.253 DST=89.108.200.112 LEN=180 TOS=0x00 PREC=0x00 TTL=63 ID=31070 PROTO=UDP SPT=40110 DPT=4500 LEN=160 MARK=0x40cb0042
Sep 21 19:43:26 kernel: [FlexQoS Debug] IN= OUT=eth0 SRC=192.168.2.253 DST=89.108.200.112 LEN=180 TOS=0x00 PREC=0x00 TTL=63 ID=31071 PROTO=UDP SPT=40110 DPT=4500 LEN=160 MARK=0x40cb0042
Sep 21 19:43:27 kernel: [FlexQoS Debug] IN= OUT=eth0 SRC=192.168.2.253 DST=89.108.200.112 LEN=180 TOS=0x00 PREC=0x00 TTL=63 ID=31117 PROTO=UDP SPT=40110 DPT=4500 LEN=160 MARK=0x40cb0042
Sep 21 19:43:27 kernel: [FlexQoS Debug] IN= OUT=eth0 SRC=192.168.2.253 DST=89.108.200.112 LEN=180 TOS=0x00 PREC=0x00 TTL=63 ID=31118 PROTO=UDP SPT=40110 DPT=4500 LEN=160 MARK=0x40cb0042
Sep 21 19:43:27 kernel: [FlexQoS Debug] IN= OUT=eth0 SRC=192.168.2.253 DST=89.108.200.112 LEN=932 TOS=0x00 PREC=0x00 TTL=63 ID=31119 PROTO=UDP SPT=40110 DPT=4500 LEN=912 MARK=0x40cb0042
Sep 21 19:43:27 kernel: [FlexQoS Debug] IN= OUT=eth0 SRC=192.168.2.253 DST=89.108.200.112 LEN=180 TOS=0x18 PREC=0xA0 TTL=63 ID=31120 PROTO=UDP SPT=40110 DPT=4500 LEN=160 MARK=0x40cb0042
Sep 21 19:43:27 kernel: [FlexQoS Debug] IN= OUT=eth0 SRC=192.168.2.253 DST=89.108.200.112 LEN=164 TOS=0x18 PREC=0xA0 TTL=63 ID=31123 PROTO=UDP SPT=40110 DPT=4500 LEN=144 MARK=0x40cb0042
Sep 21 19:43:27 kernel: [FlexQoS Debug] IN= OUT=eth0 SRC=192.168.2.253 DST=89.108.200.112 LEN=148 TOS=0x18 PREC=0xA0 TTL=63 ID=31124 PROTO=UDP SPT=40110 DPT=4500 LEN=128 MARK=0x40cb0042
Sep 21 19:43:27 kernel: [FlexQoS Debug] IN= OUT=eth0 SRC=192.168.2.253 DST=89.108.200.112 LEN=148 TOS=0x18 PREC=0xA0 TTL=63 ID=31126 PROTO=UDP SPT=40110 DPT=4500 LEN=128 MARK=0x40cb0042
Sep 21 19:43:27 kernel: [FlexQoS Debug] IN= OUT=eth0 SRC=192.168.2.253 DST=89.108.200.112 LEN=164 TOS=0x18 PREC=0xA0 TTL=63 ID=31127 PROTO=UDP SPT=40110 DPT=4500 LEN=144 MARK=0x40cb0042
Sep 21 19:43:27 kernel: [FlexQoS Debug] IN= OUT=eth0 SRC=192.168.2.253 DST=89.108.200.112 LEN=164 TOS=0x18 PREC=0xA0 TTL=63 ID=31129 PROTO=UDP SPT=40110 DPT=4500 LEN=144 MARK=0x40cb0042
Sep 21 19:43:27 kernel: [FlexQoS Debug] IN= OUT=eth0 SRC=192.168.2.253 DST=89.108.200.112 LEN=164 TOS=0x18 PREC=0xA0 TTL=63 ID=31131 PROTO=UDP SPT=40110 DPT=4500 LEN=144 MARK=0x40cb0042
Sep 21 19:43:27 kernel: [FlexQoS Debug] IN= OUT=eth0 SRC=192.168.2.253 DST=89.108.200.112 LEN=148 TOS=0x18 PREC=0xA0 TTL=63 ID=31132 PROTO=UDP SPT=40110 DPT=4500 LEN=128 MARK=0x40cb0042
Sep 21 19:43:27 kernel: [FlexQoS Debug] IN= OUT=eth0 SRC=192.168.2.253 DST=89.108.200.112 LEN=148 TOS=0x18 PREC=0xA0 TTL=63 ID=31136 PROTO=UDP SPT=40110 DPT=4500 LEN=128 MARK=0x40cb0042
Sep 21 19:43:27 kernel: [FlexQoS Debug] IN= OUT=eth0 SRC=192.168.2.253 DST=89.108.200.112 LEN=148 TOS=0x18 PREC=0xA0 TTL=63 ID=31141 PROTO=UDP SPT=40110 DPT=4500 LEN=128 MARK=0x40cb0042
Sep 21 19:43:27 kernel: [FlexQoS Debug] IN= OUT=eth0 SRC=192.168.2.253 DST=89.108.200.112 LEN=148 TOS=0x18 PREC=0xA0 TTL=63 ID=31147 PROTO=UDP SPT=40110 DPT=4500 LEN=128 MARK=0x40cb0042
Sep 21 19:43:27 kernel: [FlexQoS Debug] IN= OUT=eth0 SRC=192.168.2.253 DST=89.108.200.112 LEN=148 TOS=0x18 PREC=0xA0 TTL=63 ID=31153 PROTO=UDP SPT=40110 DPT=4500 LEN=128 MARK=0x40cb0042
Sep 21 19:43:28 kernel: [FlexQoS Debug] IN= OUT=eth0 SRC=192.168.2.253 DST=89.108.200.112 LEN=148 TOS=0x18 PREC=0xA0 TTL=63 ID=31157 PROTO=UDP SPT=40110 DPT=4500 LEN=128 MARK=0x40cb0042
Sep 21 19:43:28 kernel: [FlexQoS Debug] IN= OUT=eth0 SRC=192.168.2.253 DST=89.108.200.112 LEN=148 TOS=0x18 PREC=0xA0 TTL=63 ID=31168 PROTO=UDP SPT=40110 DPT=4500 LEN=128 MARK=0x40cb0042
Sep 21 19:43:28 kernel: [FlexQoS Debug] IN= OUT=eth0 SRC=192.168.2.253 DST=89.108.200.112 LEN=148 TOS=0x18 PREC=0xA0 TTL=63 ID=31178 PROTO=UDP SPT=40110 DPT=4500 LEN=128 MARK=0x40cb0042
Sep 21 19:43:28 kernel: [FlexQoS Debug] IN= OUT=eth0 SRC=192.168.2.253 DST=89.108.200.112 LEN=148 TOS=0x18 PREC=0xA0 TTL=63 ID=31186 PROTO=UDP SPT=40110 DPT=4500 LEN=128 MARK=0x40cb0042
Sep 21 19:43:28 kernel: [FlexQoS Debug] IN= OUT=eth0 SRC=192.168.2.253 DST=89.108.200.112 LEN=148 TOS=0x18 PREC=0xA0 TTL=63 ID=31198 PROTO=UDP SPT=40110 DPT=4500 LEN=128 MARK=0x40cb0042
Sep 21 19:43:28 kernel: [FlexQoS Debug] IN= OUT=eth0 SRC=192.168.2.253 DST=89.108.200.112 LEN=148 TOS=0x18 PREC=0xA0 TTL=63 ID=31203 PROTO=UDP SPT=40110 DPT=4500 LEN=128 MARK=0x40cb0042
Sep 21 19:43:29 kernel: [FlexQoS Debug] IN= OUT=eth0 SRC=192.168.2.253 DST=89.108.200.112 LEN=148 TOS=0x18 PREC=0xA0 TTL=63 ID=31206 PROTO=UDP SPT=40110 DPT=4500 LEN=128 MARK=0x10a87500
Sep 21 19:43:35 kernel: [FlexQoS Debug] IN= OUT=eth0 SRC=192.168.2.253 DST=89.108.200.112 LEN=1140 TOS=0x00 PREC=0x00 TTL=63 ID=31584 PROTO=UDP SPT=40110 DPT=4500 LEN=1120 MARK=0x10a87500

Test result, with the rule disabled.. I made a call using WIFI CALLING.
 
Code:
Sep 21 19:43:28 kernel: [FlexQoS Debug] IN= OUT=eth0 SRC=192.168.2.253 DST=89.108.200.112 LEN=148 TOS=0x18 PREC=0xA0 TTL=63 ID=31203 PROTO=UDP SPT=40110 DPT=4500 LEN=128 MARK=0x40cb0042
Sep 21 19:43:29 kernel: [FlexQoS Debug] IN= OUT=eth0 SRC=192.168.2.253 DST=89.108.200.112 LEN=148 TOS=0x18 PREC=0xA0 TTL=63 ID=31206 PROTO=UDP SPT=40110 DPT=4500 LEN=128 MARK=0x10a87500
Sep 21 19:43:35 kernel: [FlexQoS Debug] IN= OUT=eth0 SRC=192.168.2.253 DST=89.108.200.112 LEN=1140 TOS=0x00 PREC=0x00 TTL=63 ID=31584 PROTO=UDP SPT=40110 DPT=4500 LEN=1120 MARK=0x10a87500
It’s extremely interesting that the mark changed in the middle of the session. There must be something new going on with Adaptive QoS.

If you can perform another call and then run:
Code:
grep -F "port=4500 " /proc/bw_cte_dump
That would be helpful as well. Run it a few times in a row to see if the mark value changes there as well.
 
It’s extremely interesting that the mark changed in the middle of the session. There must be something new going on with Adaptive QoS.
Yes :)
If you can perform another call and then run:
Code:
grep -F "port=4500 " /proc/bw_cte_dump
That would be helpful as well. Run it a few times in a row to see if the mark value changes there as well.
Only this shown .. even when I connect several times.
Code:
dex@RT-AX88U_Pro-B440:/tmp/home/root# grep -F "port=4500 " /proc/bw_cte_dump
ipv4 udp src=192.168.2.253 dst=89.108.200.112 sport=40110 dport=4500 index=426 mark=80cb0042
 
Yes :)

Only this shown .. even when I connect several times.
Code:
dex@RT-AX88U_Pro-B440:/tmp/home/root# grep -F "port=4500 " /proc/bw_cte_dump
ipv4 udp src=192.168.2.253 dst=89.108.200.112 sport=40110 dport=4500 index=426 mark=80cb0042
Thanks for this valuable information. I will need to study it and the changes from 388.2 to 388.4 to get some ideas what is happening.
 

Similar threads

Latest threads

Support SNBForums w/ Amazon

If you'd like to support SNBForums, just use this link and buy anything on Amazon. Thanks!

Sign Up For SNBForums Daily Digest

Get an update of what's new every day delivered to your mailbox. Sign up here!
Back
Top